Immigrants from South America vs Immigrants from Jamaica Unemployment Among Ages 30 to 34 years
COMPARE
Immigrants from South America
Immigrants from Jamaica
Unemployment Among Ages 30 to 34 years
Unemployment Among Ages 30 to 34 years Comparison
Immigrants from South America
Immigrants from Jamaica
5.5%
UNEMPLOYMENT AMONG AGES 30 TO 34 YEARS
29.8/ 100
METRIC RATING
196th/ 347
METRIC RANK
6.5%
UNEMPLOYMENT AMONG AGES 30 TO 34 YEARS
0.0/ 100
METRIC RATING
296th/ 347
METRIC RANK
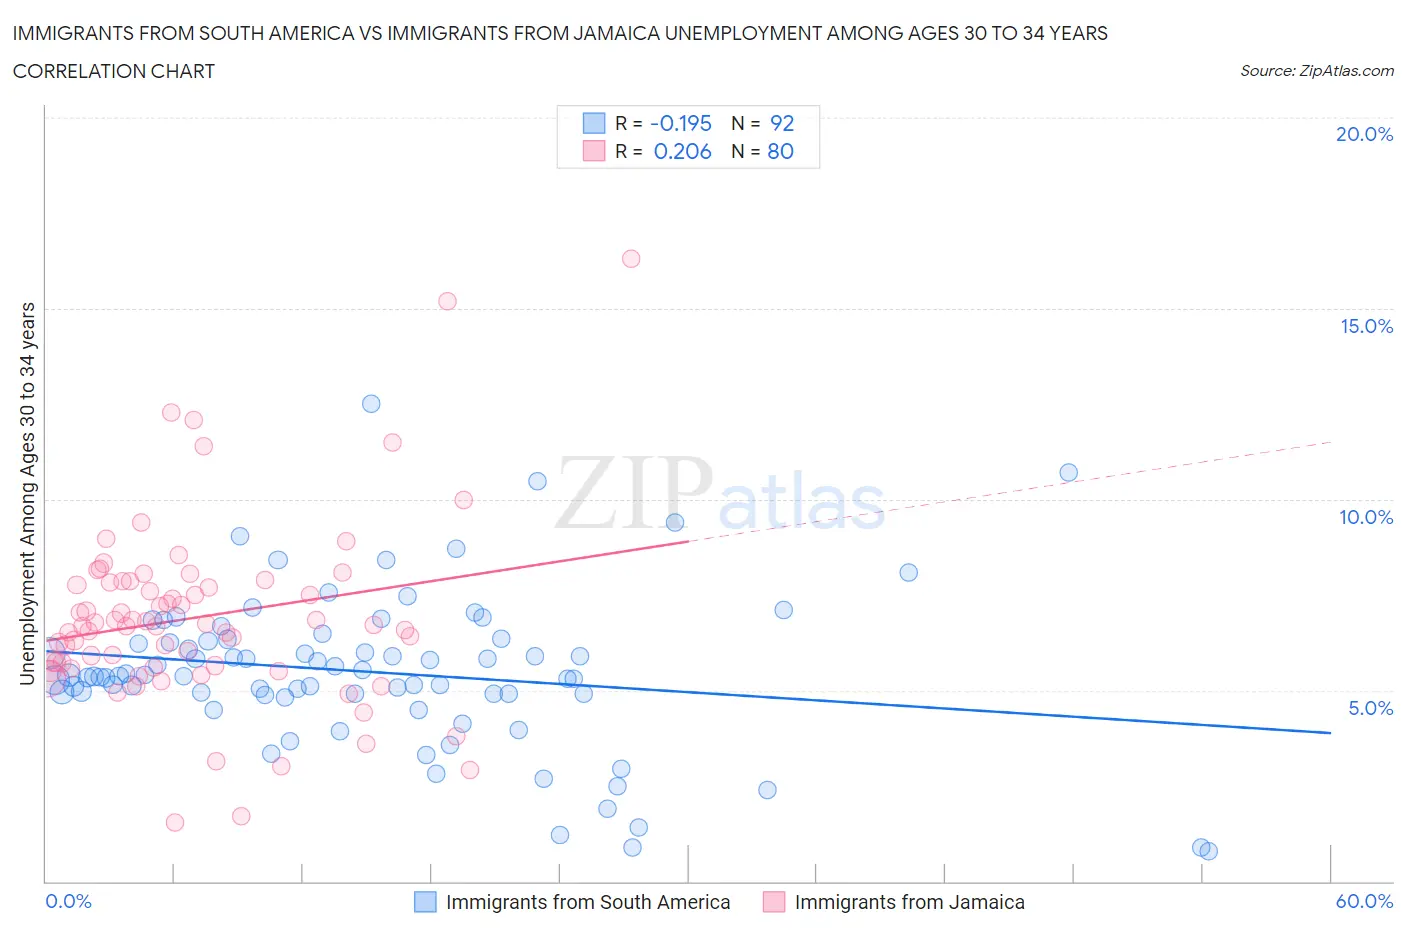
Immigrants from South America vs Immigrants from Jamaica Unemployment Among Ages 30 to 34 years Correlation Chart
The statistical analysis conducted on geographies consisting of 448,094,916 people shows a poor negative correlation between the proportion of Immigrants from South America and unemployment rate among population between the ages 30 and 34 in the United States with a correlation coefficient (R) of -0.195 and weighted average of 5.5%. Similarly, the statistical analysis conducted on geographies consisting of 289,463,038 people shows a weak positive correlation between the proportion of Immigrants from Jamaica and unemployment rate among population between the ages 30 and 34 in the United States with a correlation coefficient (R) of 0.206 and weighted average of 6.5%, a difference of 18.1%.
Unemployment Among Ages 30 to 34 years Correlation Summary
| Measurement | Immigrants from South America | Immigrants from Jamaica |
| Minimum | 0.80% | 1.5% |
| Maximum | 12.5% | 16.3% |
| Range | 11.7% | 14.8% |
| Mean | 5.5% | 6.9% |
| Median | 5.4% | 6.7% |
| Interquartile 25% (IQ1) | 4.9% | 5.6% |
| Interquartile 75% (IQ3) | 6.3% | 7.8% |
| Interquartile Range (IQR) | 1.4% | 2.2% |
| Standard Deviation (Sample) | 2.0% | 2.4% |
| Standard Deviation (Population) | 2.0% | 2.4% |
Similar Demographics by Unemployment Among Ages 30 to 34 years
Demographics Similar to Immigrants from South America by Unemployment Among Ages 30 to 34 years
In terms of unemployment among ages 30 to 34 years, the demographic groups most similar to Immigrants from South America are Finnish (5.5%, a difference of 0.070%), Immigrants from Nicaragua (5.5%, a difference of 0.080%), Slavic (5.5%, a difference of 0.090%), Immigrants from Africa (5.5%, a difference of 0.10%), and Irish (5.5%, a difference of 0.12%).
| Demographics | Rating | Rank | Unemployment Among Ages 30 to 34 years |
| Immigrants | England | 35.7 /100 | #189 | Fair 5.5% |
| Immigrants | Kazakhstan | 33.9 /100 | #190 | Fair 5.5% |
| Irish | 31.3 /100 | #191 | Fair 5.5% |
| Moroccans | 31.2 /100 | #192 | Fair 5.5% |
| Immigrants | Africa | 31.0 /100 | #193 | Fair 5.5% |
| Slavs | 30.9 /100 | #194 | Fair 5.5% |
| Finns | 30.7 /100 | #195 | Fair 5.5% |
| Immigrants | South America | 29.8 /100 | #196 | Fair 5.5% |
| Immigrants | Nicaragua | 28.9 /100 | #197 | Fair 5.5% |
| Immigrants | Afghanistan | 27.2 /100 | #198 | Fair 5.6% |
| Nicaraguans | 26.6 /100 | #199 | Fair 5.6% |
| Immigrants | Southern Europe | 25.8 /100 | #200 | Fair 5.6% |
| South American Indians | 24.4 /100 | #201 | Fair 5.6% |
| Immigrants | Germany | 22.9 /100 | #202 | Fair 5.6% |
| Koreans | 20.7 /100 | #203 | Fair 5.6% |
Demographics Similar to Immigrants from Jamaica by Unemployment Among Ages 30 to 34 years
In terms of unemployment among ages 30 to 34 years, the demographic groups most similar to Immigrants from Jamaica are Trinidadian and Tobagonian (6.5%, a difference of 0.050%), Creek (6.6%, a difference of 0.10%), Barbadian (6.5%, a difference of 0.29%), Immigrants from Barbados (6.6%, a difference of 0.35%), and Dutch West Indian (6.6%, a difference of 0.45%).
| Demographics | Rating | Rank | Unemployment Among Ages 30 to 34 years |
| Menominee | 0.0 /100 | #289 | Tragic 6.4% |
| Immigrants | Trinidad and Tobago | 0.0 /100 | #290 | Tragic 6.5% |
| Jamaicans | 0.0 /100 | #291 | Tragic 6.5% |
| Vietnamese | 0.0 /100 | #292 | Tragic 6.5% |
| West Indians | 0.0 /100 | #293 | Tragic 6.5% |
| Barbadians | 0.0 /100 | #294 | Tragic 6.5% |
| Trinidadians and Tobagonians | 0.0 /100 | #295 | Tragic 6.5% |
| Immigrants | Jamaica | 0.0 /100 | #296 | Tragic 6.5% |
| Creek | 0.0 /100 | #297 | Tragic 6.6% |
| Immigrants | Barbados | 0.0 /100 | #298 | Tragic 6.6% |
| Dutch West Indians | 0.0 /100 | #299 | Tragic 6.6% |
| Bahamians | 0.0 /100 | #300 | Tragic 6.6% |
| Belizeans | 0.0 /100 | #301 | Tragic 6.6% |
| Delaware | 0.0 /100 | #302 | Tragic 6.7% |
| Cajuns | 0.0 /100 | #303 | Tragic 6.7% |