Armenian vs Immigrants from Jamaica Unemployment Among Ages 30 to 34 years
COMPARE
Armenian
Immigrants from Jamaica
Unemployment Among Ages 30 to 34 years
Unemployment Among Ages 30 to 34 years Comparison
Armenians
Immigrants from Jamaica
6.1%
UNEMPLOYMENT AMONG AGES 30 TO 34 YEARS
0.1/ 100
METRIC RATING
254th/ 347
METRIC RANK
6.5%
UNEMPLOYMENT AMONG AGES 30 TO 34 YEARS
0.0/ 100
METRIC RATING
296th/ 347
METRIC RANK
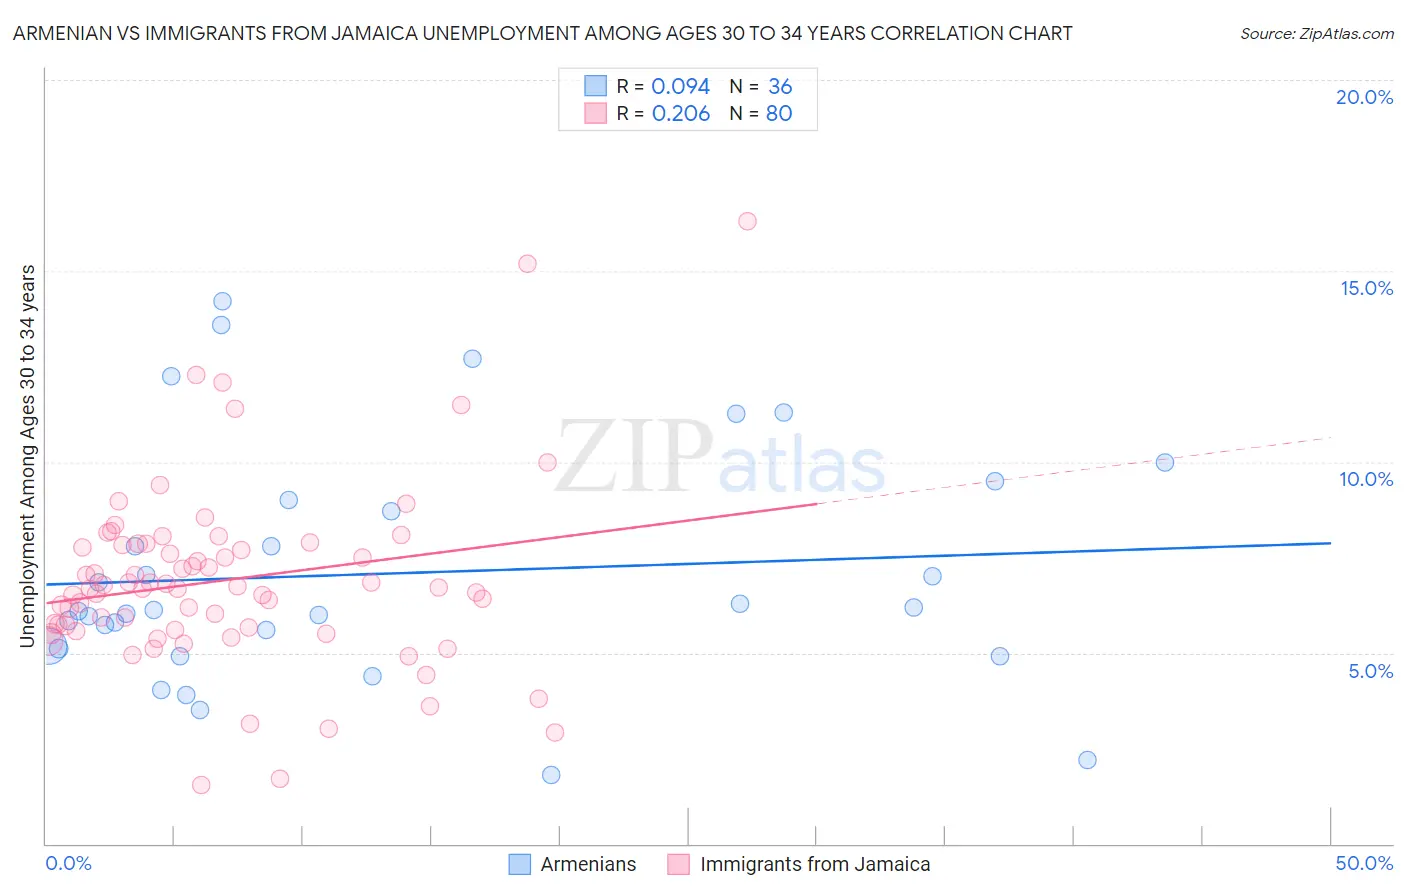
Armenian vs Immigrants from Jamaica Unemployment Among Ages 30 to 34 years Correlation Chart
The statistical analysis conducted on geographies consisting of 295,669,419 people shows a slight positive correlation between the proportion of Armenians and unemployment rate among population between the ages 30 and 34 in the United States with a correlation coefficient (R) of 0.094 and weighted average of 6.1%. Similarly, the statistical analysis conducted on geographies consisting of 289,463,038 people shows a weak positive correlation between the proportion of Immigrants from Jamaica and unemployment rate among population between the ages 30 and 34 in the United States with a correlation coefficient (R) of 0.206 and weighted average of 6.5%, a difference of 7.5%.
Unemployment Among Ages 30 to 34 years Correlation Summary
| Measurement | Armenian | Immigrants from Jamaica |
| Minimum | 1.8% | 1.5% |
| Maximum | 14.2% | 16.3% |
| Range | 12.4% | 14.8% |
| Mean | 7.1% | 6.9% |
| Median | 6.1% | 6.7% |
| Interquartile 25% (IQ1) | 5.2% | 5.6% |
| Interquartile 75% (IQ3) | 8.8% | 7.8% |
| Interquartile Range (IQR) | 3.7% | 2.2% |
| Standard Deviation (Sample) | 3.1% | 2.4% |
| Standard Deviation (Population) | 3.0% | 2.4% |
Similar Demographics by Unemployment Among Ages 30 to 34 years
Demographics Similar to Armenians by Unemployment Among Ages 30 to 34 years
In terms of unemployment among ages 30 to 34 years, the demographic groups most similar to Armenians are Immigrants from Portugal (6.1%, a difference of 0.31%), Immigrants from Ghana (6.1%, a difference of 0.51%), Immigrants from Sierra Leone (6.1%, a difference of 0.55%), Mexican (6.1%, a difference of 0.62%), and Nonimmigrants (6.1%, a difference of 0.63%).
| Demographics | Rating | Rank | Unemployment Among Ages 30 to 34 years |
| Nigerians | 0.3 /100 | #247 | Tragic 6.0% |
| Immigrants | Guatemala | 0.3 /100 | #248 | Tragic 6.0% |
| Hondurans | 0.3 /100 | #249 | Tragic 6.0% |
| Immigrants | Honduras | 0.3 /100 | #250 | Tragic 6.0% |
| Tlingit-Haida | 0.2 /100 | #251 | Tragic 6.0% |
| Potawatomi | 0.2 /100 | #252 | Tragic 6.0% |
| Immigrants | Nonimmigrants | 0.2 /100 | #253 | Tragic 6.1% |
| Armenians | 0.1 /100 | #254 | Tragic 6.1% |
| Immigrants | Portugal | 0.1 /100 | #255 | Tragic 6.1% |
| Immigrants | Ghana | 0.1 /100 | #256 | Tragic 6.1% |
| Immigrants | Sierra Leone | 0.1 /100 | #257 | Tragic 6.1% |
| Mexicans | 0.1 /100 | #258 | Tragic 6.1% |
| Haitians | 0.1 /100 | #259 | Tragic 6.1% |
| Immigrants | Latin America | 0.1 /100 | #260 | Tragic 6.1% |
| Immigrants | Western Africa | 0.1 /100 | #261 | Tragic 6.2% |
Demographics Similar to Immigrants from Jamaica by Unemployment Among Ages 30 to 34 years
In terms of unemployment among ages 30 to 34 years, the demographic groups most similar to Immigrants from Jamaica are Trinidadian and Tobagonian (6.5%, a difference of 0.050%), Creek (6.6%, a difference of 0.10%), Barbadian (6.5%, a difference of 0.29%), Immigrants from Barbados (6.6%, a difference of 0.35%), and Dutch West Indian (6.6%, a difference of 0.45%).
| Demographics | Rating | Rank | Unemployment Among Ages 30 to 34 years |
| Menominee | 0.0 /100 | #289 | Tragic 6.4% |
| Immigrants | Trinidad and Tobago | 0.0 /100 | #290 | Tragic 6.5% |
| Jamaicans | 0.0 /100 | #291 | Tragic 6.5% |
| Vietnamese | 0.0 /100 | #292 | Tragic 6.5% |
| West Indians | 0.0 /100 | #293 | Tragic 6.5% |
| Barbadians | 0.0 /100 | #294 | Tragic 6.5% |
| Trinidadians and Tobagonians | 0.0 /100 | #295 | Tragic 6.5% |
| Immigrants | Jamaica | 0.0 /100 | #296 | Tragic 6.5% |
| Creek | 0.0 /100 | #297 | Tragic 6.6% |
| Immigrants | Barbados | 0.0 /100 | #298 | Tragic 6.6% |
| Dutch West Indians | 0.0 /100 | #299 | Tragic 6.6% |
| Bahamians | 0.0 /100 | #300 | Tragic 6.6% |
| Belizeans | 0.0 /100 | #301 | Tragic 6.6% |
| Delaware | 0.0 /100 | #302 | Tragic 6.7% |
| Cajuns | 0.0 /100 | #303 | Tragic 6.7% |