Argentinean vs Immigrants from Jamaica Unemployment Among Ages 30 to 34 years
COMPARE
Argentinean
Immigrants from Jamaica
Unemployment Among Ages 30 to 34 years
Unemployment Among Ages 30 to 34 years Comparison
Argentineans
Immigrants from Jamaica
5.3%
UNEMPLOYMENT AMONG AGES 30 TO 34 YEARS
87.9/ 100
METRIC RATING
105th/ 347
METRIC RANK
6.5%
UNEMPLOYMENT AMONG AGES 30 TO 34 YEARS
0.0/ 100
METRIC RATING
296th/ 347
METRIC RANK
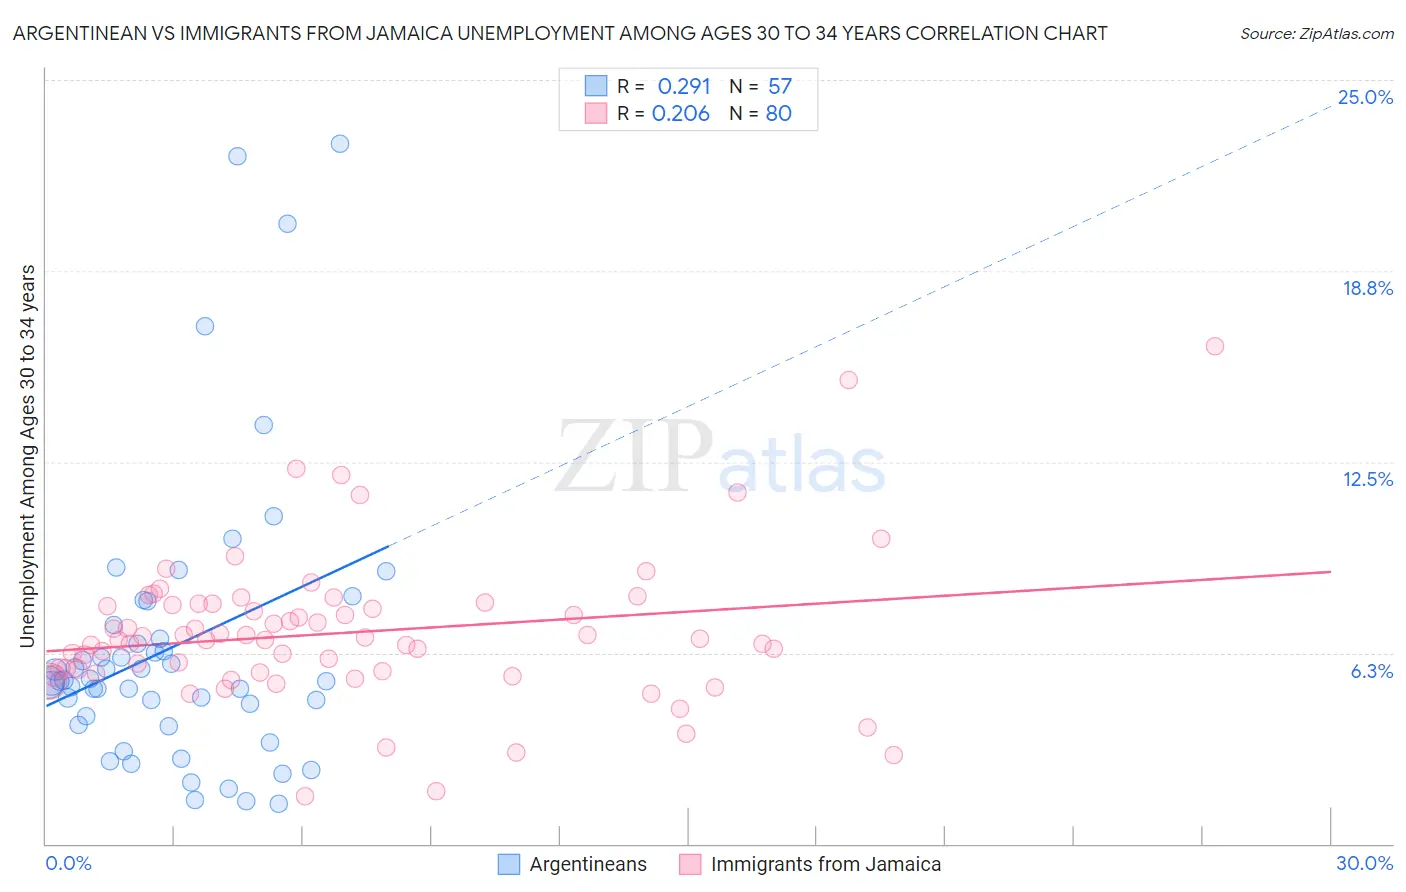
Argentinean vs Immigrants from Jamaica Unemployment Among Ages 30 to 34 years Correlation Chart
The statistical analysis conducted on geographies consisting of 285,989,104 people shows a weak positive correlation between the proportion of Argentineans and unemployment rate among population between the ages 30 and 34 in the United States with a correlation coefficient (R) of 0.291 and weighted average of 5.3%. Similarly, the statistical analysis conducted on geographies consisting of 289,463,038 people shows a weak positive correlation between the proportion of Immigrants from Jamaica and unemployment rate among population between the ages 30 and 34 in the United States with a correlation coefficient (R) of 0.206 and weighted average of 6.5%, a difference of 24.2%.
Unemployment Among Ages 30 to 34 years Correlation Summary
| Measurement | Argentinean | Immigrants from Jamaica |
| Minimum | 1.3% | 1.5% |
| Maximum | 22.9% | 16.3% |
| Range | 21.6% | 14.8% |
| Mean | 6.5% | 6.9% |
| Median | 5.3% | 6.7% |
| Interquartile 25% (IQ1) | 4.0% | 5.6% |
| Interquartile 75% (IQ3) | 6.9% | 7.8% |
| Interquartile Range (IQR) | 2.9% | 2.2% |
| Standard Deviation (Sample) | 4.6% | 2.4% |
| Standard Deviation (Population) | 4.6% | 2.4% |
Similar Demographics by Unemployment Among Ages 30 to 34 years
Demographics Similar to Argentineans by Unemployment Among Ages 30 to 34 years
In terms of unemployment among ages 30 to 34 years, the demographic groups most similar to Argentineans are Northern European (5.3%, a difference of 0.0%), Croatian (5.3%, a difference of 0.050%), Icelander (5.3%, a difference of 0.11%), Immigrants from Middle Africa (5.3%, a difference of 0.12%), and Immigrants from Jordan (5.3%, a difference of 0.16%).
| Demographics | Rating | Rank | Unemployment Among Ages 30 to 34 years |
| Immigrants | North Macedonia | 90.9 /100 | #98 | Exceptional 5.2% |
| Immigrants | Ireland | 90.6 /100 | #99 | Exceptional 5.2% |
| Immigrants | Czechoslovakia | 89.5 /100 | #100 | Excellent 5.3% |
| British | 89.1 /100 | #101 | Excellent 5.3% |
| Immigrants | Switzerland | 88.8 /100 | #102 | Excellent 5.3% |
| Immigrants | Jordan | 88.8 /100 | #103 | Excellent 5.3% |
| Northern Europeans | 87.9 /100 | #104 | Excellent 5.3% |
| Argentineans | 87.9 /100 | #105 | Excellent 5.3% |
| Croatians | 87.6 /100 | #106 | Excellent 5.3% |
| Icelanders | 87.2 /100 | #107 | Excellent 5.3% |
| Immigrants | Middle Africa | 87.1 /100 | #108 | Excellent 5.3% |
| Immigrants | Chile | 86.7 /100 | #109 | Excellent 5.3% |
| Egyptians | 86.4 /100 | #110 | Excellent 5.3% |
| Immigrants | Pakistan | 86.2 /100 | #111 | Excellent 5.3% |
| Swiss | 85.9 /100 | #112 | Excellent 5.3% |
Demographics Similar to Immigrants from Jamaica by Unemployment Among Ages 30 to 34 years
In terms of unemployment among ages 30 to 34 years, the demographic groups most similar to Immigrants from Jamaica are Trinidadian and Tobagonian (6.5%, a difference of 0.050%), Creek (6.6%, a difference of 0.10%), Barbadian (6.5%, a difference of 0.29%), Immigrants from Barbados (6.6%, a difference of 0.35%), and Dutch West Indian (6.6%, a difference of 0.45%).
| Demographics | Rating | Rank | Unemployment Among Ages 30 to 34 years |
| Menominee | 0.0 /100 | #289 | Tragic 6.4% |
| Immigrants | Trinidad and Tobago | 0.0 /100 | #290 | Tragic 6.5% |
| Jamaicans | 0.0 /100 | #291 | Tragic 6.5% |
| Vietnamese | 0.0 /100 | #292 | Tragic 6.5% |
| West Indians | 0.0 /100 | #293 | Tragic 6.5% |
| Barbadians | 0.0 /100 | #294 | Tragic 6.5% |
| Trinidadians and Tobagonians | 0.0 /100 | #295 | Tragic 6.5% |
| Immigrants | Jamaica | 0.0 /100 | #296 | Tragic 6.5% |
| Creek | 0.0 /100 | #297 | Tragic 6.6% |
| Immigrants | Barbados | 0.0 /100 | #298 | Tragic 6.6% |
| Dutch West Indians | 0.0 /100 | #299 | Tragic 6.6% |
| Bahamians | 0.0 /100 | #300 | Tragic 6.6% |
| Belizeans | 0.0 /100 | #301 | Tragic 6.6% |
| Delaware | 0.0 /100 | #302 | Tragic 6.7% |
| Cajuns | 0.0 /100 | #303 | Tragic 6.7% |