Immigrants from Serbia vs Immigrants from Barbados Unemployment Among Seniors over 75 years
COMPARE
Immigrants from Serbia
Immigrants from Barbados
Unemployment Among Seniors over 75 years
Unemployment Among Seniors over 75 years Comparison
Immigrants from Serbia
Immigrants from Barbados
8.2%
UNEMPLOYMENT AMONG SENIORS OVER 75 YEARS
99.2/ 100
METRIC RATING
101st/ 347
METRIC RANK
7.6%
UNEMPLOYMENT AMONG SENIORS OVER 75 YEARS
100.0/ 100
METRIC RATING
27th/ 347
METRIC RANK
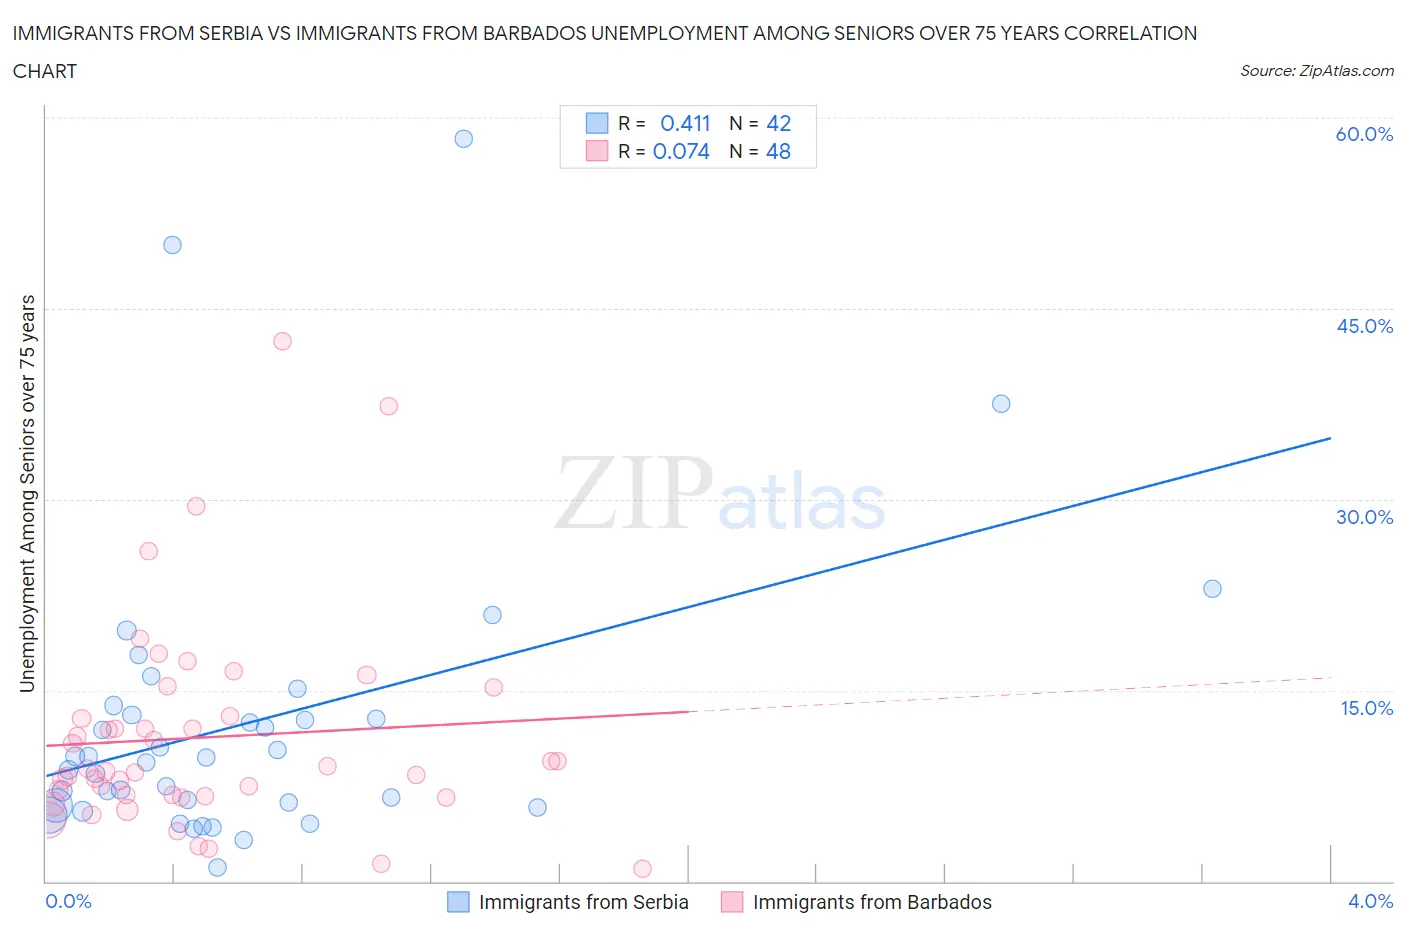
Immigrants from Serbia vs Immigrants from Barbados Unemployment Among Seniors over 75 years Correlation Chart
The statistical analysis conducted on geographies consisting of 95,012,022 people shows a moderate positive correlation between the proportion of Immigrants from Serbia and unemployment rate among seniors over the age of 75 in the United States with a correlation coefficient (R) of 0.411 and weighted average of 8.2%. Similarly, the statistical analysis conducted on geographies consisting of 81,625,004 people shows a slight positive correlation between the proportion of Immigrants from Barbados and unemployment rate among seniors over the age of 75 in the United States with a correlation coefficient (R) of 0.074 and weighted average of 7.6%, a difference of 8.2%.
Unemployment Among Seniors over 75 years Correlation Summary
| Measurement | Immigrants from Serbia | Immigrants from Barbados |
| Minimum | 1.1% | 1.0% |
| Maximum | 58.3% | 42.4% |
| Range | 57.2% | 41.4% |
| Mean | 12.4% | 11.3% |
| Median | 9.5% | 8.7% |
| Interquartile 25% (IQ1) | 6.0% | 6.7% |
| Interquartile 75% (IQ3) | 13.1% | 12.9% |
| Interquartile Range (IQR) | 7.1% | 6.2% |
| Standard Deviation (Sample) | 11.5% | 8.3% |
| Standard Deviation (Population) | 11.4% | 8.2% |
Similar Demographics by Unemployment Among Seniors over 75 years
Demographics Similar to Immigrants from Serbia by Unemployment Among Seniors over 75 years
In terms of unemployment among seniors over 75 years, the demographic groups most similar to Immigrants from Serbia are Burmese (8.2%, a difference of 0.050%), Immigrants from Kazakhstan (8.2%, a difference of 0.050%), Immigrants from Panama (8.2%, a difference of 0.090%), Immigrants from Northern Africa (8.2%, a difference of 0.14%), and Immigrants from Sri Lanka (8.2%, a difference of 0.19%).
| Demographics | Rating | Rank | Unemployment Among Seniors over 75 years |
| Immigrants | Ireland | 99.4 /100 | #94 | Exceptional 8.1% |
| Nicaraguans | 99.3 /100 | #95 | Exceptional 8.2% |
| Immigrants | Belgium | 99.3 /100 | #96 | Exceptional 8.2% |
| Immigrants | Sri Lanka | 99.3 /100 | #97 | Exceptional 8.2% |
| Immigrants | Northern Africa | 99.3 /100 | #98 | Exceptional 8.2% |
| Burmese | 99.2 /100 | #99 | Exceptional 8.2% |
| Immigrants | Kazakhstan | 99.2 /100 | #100 | Exceptional 8.2% |
| Immigrants | Serbia | 99.2 /100 | #101 | Exceptional 8.2% |
| Immigrants | Panama | 99.1 /100 | #102 | Exceptional 8.2% |
| South American Indians | 99.1 /100 | #103 | Exceptional 8.2% |
| Immigrants | South Central Asia | 99.0 /100 | #104 | Exceptional 8.2% |
| Immigrants | Caribbean | 99.0 /100 | #105 | Exceptional 8.2% |
| Immigrants | Honduras | 99.0 /100 | #106 | Exceptional 8.2% |
| Sri Lankans | 98.9 /100 | #107 | Exceptional 8.2% |
| Laotians | 98.8 /100 | #108 | Exceptional 8.2% |
Demographics Similar to Immigrants from Barbados by Unemployment Among Seniors over 75 years
In terms of unemployment among seniors over 75 years, the demographic groups most similar to Immigrants from Barbados are Immigrants from Israel (7.6%, a difference of 0.11%), Immigrants from Iran (7.6%, a difference of 0.15%), Immigrants from Sweden (7.6%, a difference of 0.26%), South African (7.5%, a difference of 0.44%), and Immigrants from Uruguay (7.5%, a difference of 0.62%).
| Demographics | Rating | Rank | Unemployment Among Seniors over 75 years |
| Armenians | 100.0 /100 | #20 | Exceptional 7.2% |
| Chickasaw | 100.0 /100 | #21 | Exceptional 7.3% |
| Cypriots | 100.0 /100 | #22 | Exceptional 7.4% |
| Israelis | 100.0 /100 | #23 | Exceptional 7.4% |
| Immigrants | Cuba | 100.0 /100 | #24 | Exceptional 7.4% |
| Immigrants | Uruguay | 100.0 /100 | #25 | Exceptional 7.5% |
| South Africans | 100.0 /100 | #26 | Exceptional 7.5% |
| Immigrants | Barbados | 100.0 /100 | #27 | Exceptional 7.6% |
| Immigrants | Israel | 100.0 /100 | #28 | Exceptional 7.6% |
| Immigrants | Iran | 100.0 /100 | #29 | Exceptional 7.6% |
| Immigrants | Sweden | 100.0 /100 | #30 | Exceptional 7.6% |
| Guyanese | 100.0 /100 | #31 | Exceptional 7.6% |
| Immigrants | Hong Kong | 100.0 /100 | #32 | Exceptional 7.6% |
| Cambodians | 100.0 /100 | #33 | Exceptional 7.6% |
| Immigrants | Eritrea | 100.0 /100 | #34 | Exceptional 7.7% |