Immigrants from Serbia vs Immigrants from Barbados Female Poverty Among 18-24 Year Olds
COMPARE
Immigrants from Serbia
Immigrants from Barbados
Female Poverty Among 18-24 Year Olds
Female Poverty Among 18-24 Year Olds Comparison
Immigrants from Serbia
Immigrants from Barbados
19.2%
FEMALE POVERTY AMONG 18-24 YEAR OLDS
97.1/ 100
METRIC RATING
111th/ 347
METRIC RANK
20.2%
FEMALE POVERTY AMONG 18-24 YEAR OLDS
42.8/ 100
METRIC RATING
182nd/ 347
METRIC RANK
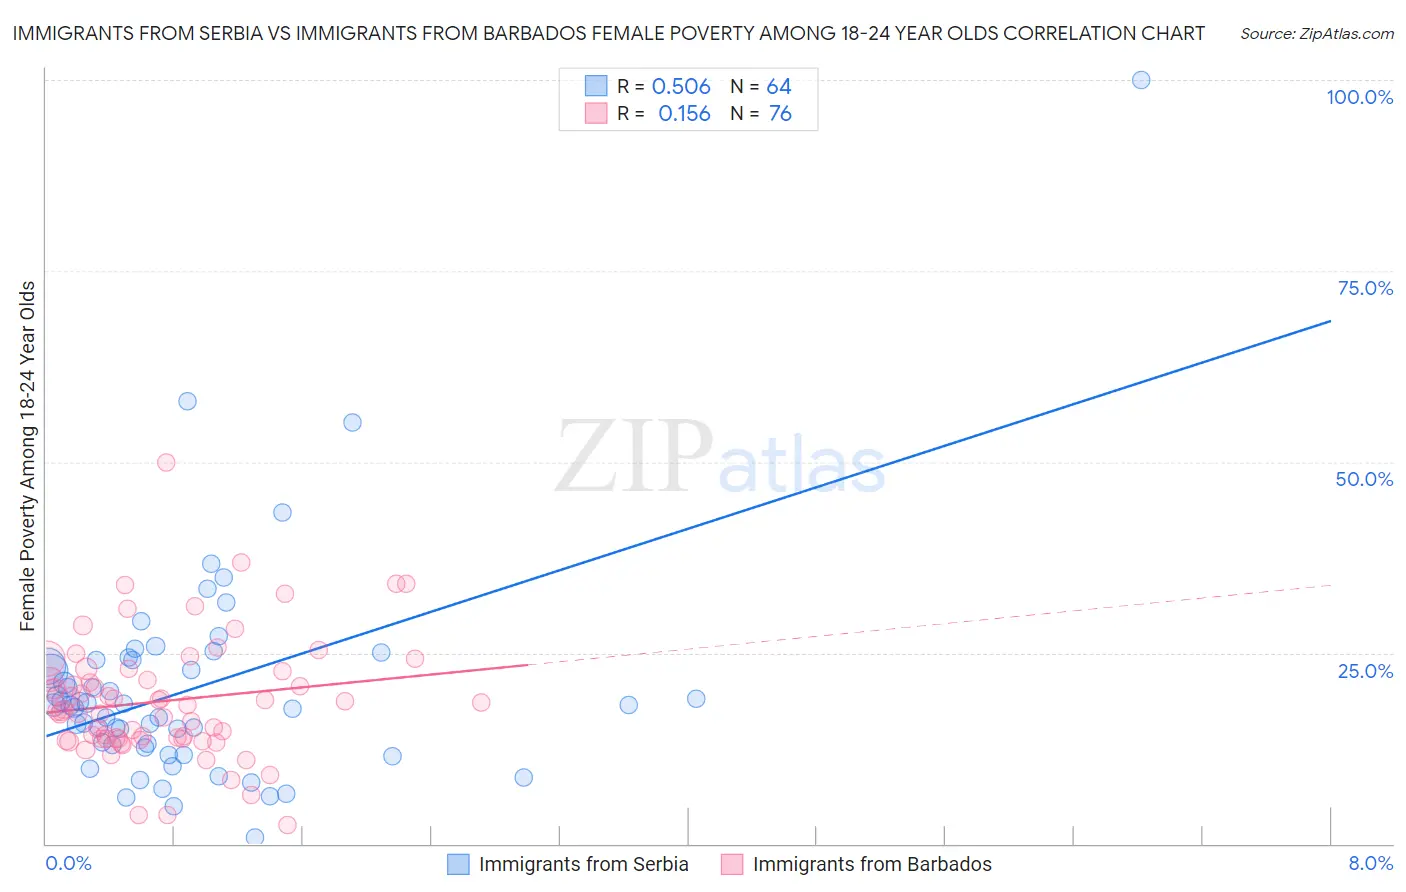
Immigrants from Serbia vs Immigrants from Barbados Female Poverty Among 18-24 Year Olds Correlation Chart
The statistical analysis conducted on geographies consisting of 130,475,309 people shows a substantial positive correlation between the proportion of Immigrants from Serbia and poverty level among females between the ages 18 and 24 in the United States with a correlation coefficient (R) of 0.506 and weighted average of 19.2%. Similarly, the statistical analysis conducted on geographies consisting of 112,082,012 people shows a poor positive correlation between the proportion of Immigrants from Barbados and poverty level among females between the ages 18 and 24 in the United States with a correlation coefficient (R) of 0.156 and weighted average of 20.2%, a difference of 4.8%.
Female Poverty Among 18-24 Year Olds Correlation Summary
| Measurement | Immigrants from Serbia | Immigrants from Barbados |
| Minimum | 0.90% | 2.5% |
| Maximum | 100.0% | 50.0% |
| Range | 99.1% | 47.5% |
| Mean | 20.4% | 18.7% |
| Median | 18.2% | 17.5% |
| Interquartile 25% (IQ1) | 12.8% | 13.7% |
| Interquartile 75% (IQ3) | 24.0% | 22.1% |
| Interquartile Range (IQR) | 11.2% | 8.4% |
| Standard Deviation (Sample) | 14.6% | 8.0% |
| Standard Deviation (Population) | 14.5% | 7.9% |
Similar Demographics by Female Poverty Among 18-24 Year Olds
Demographics Similar to Immigrants from Serbia by Female Poverty Among 18-24 Year Olds
In terms of female poverty among 18-24 year olds, the demographic groups most similar to Immigrants from Serbia are Laotian (19.2%, a difference of 0.020%), Immigrants from Syria (19.2%, a difference of 0.040%), Immigrants from Uzbekistan (19.2%, a difference of 0.12%), Immigrants from Sri Lanka (19.2%, a difference of 0.22%), and Immigrants from El Salvador (19.3%, a difference of 0.23%).
| Demographics | Rating | Rank | Female Poverty Among 18-24 Year Olds |
| Immigrants | Afghanistan | 98.0 /100 | #104 | Exceptional 19.1% |
| Immigrants | Ecuador | 97.8 /100 | #105 | Exceptional 19.2% |
| Immigrants | Sierra Leone | 97.8 /100 | #106 | Exceptional 19.2% |
| Immigrants | Sri Lanka | 97.5 /100 | #107 | Exceptional 19.2% |
| Immigrants | Uzbekistan | 97.3 /100 | #108 | Exceptional 19.2% |
| Immigrants | Syria | 97.2 /100 | #109 | Exceptional 19.2% |
| Laotians | 97.1 /100 | #110 | Exceptional 19.2% |
| Immigrants | Serbia | 97.1 /100 | #111 | Exceptional 19.2% |
| Immigrants | El Salvador | 96.5 /100 | #112 | Exceptional 19.3% |
| Immigrants | Cameroon | 96.3 /100 | #113 | Exceptional 19.3% |
| Slovenes | 96.2 /100 | #114 | Exceptional 19.3% |
| Immigrants | Hungary | 96.2 /100 | #115 | Exceptional 19.3% |
| Immigrants | Immigrants | 95.9 /100 | #116 | Exceptional 19.3% |
| Immigrants | Iran | 95.8 /100 | #117 | Exceptional 19.3% |
| Immigrants | Guyana | 95.6 /100 | #118 | Exceptional 19.3% |
Demographics Similar to Immigrants from Barbados by Female Poverty Among 18-24 Year Olds
In terms of female poverty among 18-24 year olds, the demographic groups most similar to Immigrants from Barbados are Immigrants from China (20.2%, a difference of 0.010%), Iraqi (20.2%, a difference of 0.020%), Ethiopian (20.2%, a difference of 0.050%), Immigrants from Kazakhstan (20.2%, a difference of 0.060%), and Swiss (20.2%, a difference of 0.060%).
| Demographics | Rating | Rank | Female Poverty Among 18-24 Year Olds |
| South American Indians | 48.4 /100 | #175 | Average 20.1% |
| Kenyans | 44.9 /100 | #176 | Average 20.2% |
| Immigrants | Kazakhstan | 44.2 /100 | #177 | Average 20.2% |
| Swiss | 44.0 /100 | #178 | Average 20.2% |
| Ethiopians | 43.8 /100 | #179 | Average 20.2% |
| Iraqis | 43.3 /100 | #180 | Average 20.2% |
| Immigrants | China | 43.0 /100 | #181 | Average 20.2% |
| Immigrants | Barbados | 42.8 /100 | #182 | Average 20.2% |
| Lebanese | 40.6 /100 | #183 | Average 20.2% |
| Immigrants | Central America | 39.9 /100 | #184 | Fair 20.2% |
| Nepalese | 39.7 /100 | #185 | Fair 20.2% |
| Immigrants | Ethiopia | 37.3 /100 | #186 | Fair 20.2% |
| Immigrants | Mexico | 36.3 /100 | #187 | Fair 20.2% |
| Scandinavians | 34.6 /100 | #188 | Fair 20.3% |
| Immigrants | Germany | 34.0 /100 | #189 | Fair 20.3% |