Yuman vs Immigrants from Barbados Unemployment Among Seniors over 75 years
COMPARE
Yuman
Immigrants from Barbados
Unemployment Among Seniors over 75 years
Unemployment Among Seniors over 75 years Comparison
Yuman
Immigrants from Barbados
6.7%
UNEMPLOYMENT AMONG SENIORS OVER 75 YEARS
100.0/ 100
METRIC RATING
10th/ 347
METRIC RANK
7.6%
UNEMPLOYMENT AMONG SENIORS OVER 75 YEARS
100.0/ 100
METRIC RATING
27th/ 347
METRIC RANK
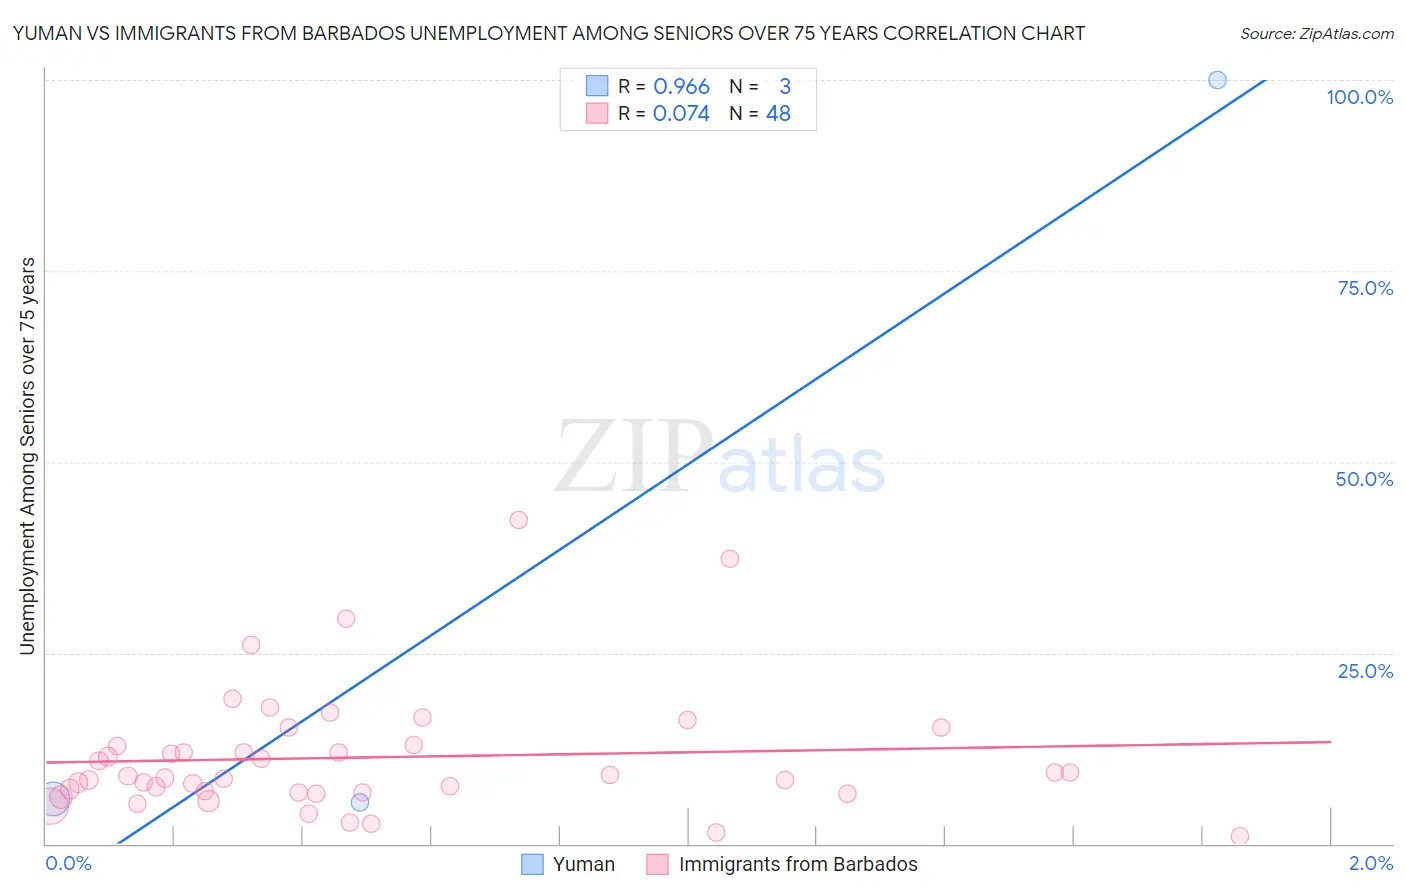
Yuman vs Immigrants from Barbados Unemployment Among Seniors over 75 years Correlation Chart
The statistical analysis conducted on geographies consisting of 34,222,991 people shows a perfect positive correlation between the proportion of Yuman and unemployment rate among seniors over the age of 75 in the United States with a correlation coefficient (R) of 0.966 and weighted average of 6.7%. Similarly, the statistical analysis conducted on geographies consisting of 81,625,004 people shows a slight positive correlation between the proportion of Immigrants from Barbados and unemployment rate among seniors over the age of 75 in the United States with a correlation coefficient (R) of 0.074 and weighted average of 7.6%, a difference of 13.5%.
Unemployment Among Seniors over 75 years Correlation Summary
| Measurement | Yuman | Immigrants from Barbados |
| Minimum | 5.4% | 1.0% |
| Maximum | 100.0% | 42.4% |
| Range | 94.6% | 41.4% |
| Mean | 37.1% | 11.3% |
| Median | 5.9% | 8.7% |
| Interquartile 25% (IQ1) | 5.4% | 6.7% |
| Interquartile 75% (IQ3) | 100.0% | 12.9% |
| Interquartile Range (IQR) | 94.6% | 6.2% |
| Standard Deviation (Sample) | 54.5% | 8.3% |
| Standard Deviation (Population) | 44.5% | 8.2% |
Demographics Similar to Yuman and Immigrants from Barbados by Unemployment Among Seniors over 75 years
In terms of unemployment among seniors over 75 years, the demographic groups most similar to Yuman are Immigrants from Grenada (6.7%, a difference of 0.10%), Soviet Union (6.6%, a difference of 0.22%), Comanche (6.7%, a difference of 0.23%), Immigrants from Congo (6.7%, a difference of 1.0%), and Taiwanese (6.6%, a difference of 1.5%). Similarly, the demographic groups most similar to Immigrants from Barbados are Immigrants from Israel (7.6%, a difference of 0.11%), South African (7.5%, a difference of 0.44%), Immigrants from Uruguay (7.5%, a difference of 0.62%), Immigrants from Cuba (7.4%, a difference of 1.8%), and Israeli (7.4%, a difference of 1.8%).
| Demographics | Rating | Rank | Unemployment Among Seniors over 75 years |
| Taiwanese | 100.0 /100 | #8 | Exceptional 6.6% |
| Soviet Union | 100.0 /100 | #9 | Exceptional 6.6% |
| Yuman | 100.0 /100 | #10 | Exceptional 6.7% |
| Immigrants | Grenada | 100.0 /100 | #11 | Exceptional 6.7% |
| Comanche | 100.0 /100 | #12 | Exceptional 6.7% |
| Immigrants | Congo | 100.0 /100 | #13 | Exceptional 6.7% |
| Ute | 100.0 /100 | #14 | Exceptional 6.8% |
| Icelanders | 100.0 /100 | #15 | Exceptional 7.0% |
| Seminole | 100.0 /100 | #16 | Exceptional 7.1% |
| Immigrants | Switzerland | 100.0 /100 | #17 | Exceptional 7.2% |
| Immigrants | Uzbekistan | 100.0 /100 | #18 | Exceptional 7.2% |
| Immigrants | Zaire | 100.0 /100 | #19 | Exceptional 7.2% |
| Armenians | 100.0 /100 | #20 | Exceptional 7.2% |
| Chickasaw | 100.0 /100 | #21 | Exceptional 7.3% |
| Cypriots | 100.0 /100 | #22 | Exceptional 7.4% |
| Israelis | 100.0 /100 | #23 | Exceptional 7.4% |
| Immigrants | Cuba | 100.0 /100 | #24 | Exceptional 7.4% |
| Immigrants | Uruguay | 100.0 /100 | #25 | Exceptional 7.5% |
| South Africans | 100.0 /100 | #26 | Exceptional 7.5% |
| Immigrants | Barbados | 100.0 /100 | #27 | Exceptional 7.6% |
| Immigrants | Israel | 100.0 /100 | #28 | Exceptional 7.6% |