Immigrants from Philippines vs Immigrants from Sierra Leone Unemployment
COMPARE
Immigrants from Philippines
Immigrants from Sierra Leone
Unemployment
Unemployment Comparison
Immigrants from Philippines
Immigrants from Sierra Leone
5.4%
UNEMPLOYMENT
10.4/ 100
METRIC RATING
221st/ 347
METRIC RANK
5.8%
UNEMPLOYMENT
0.1/ 100
METRIC RATING
268th/ 347
METRIC RANK
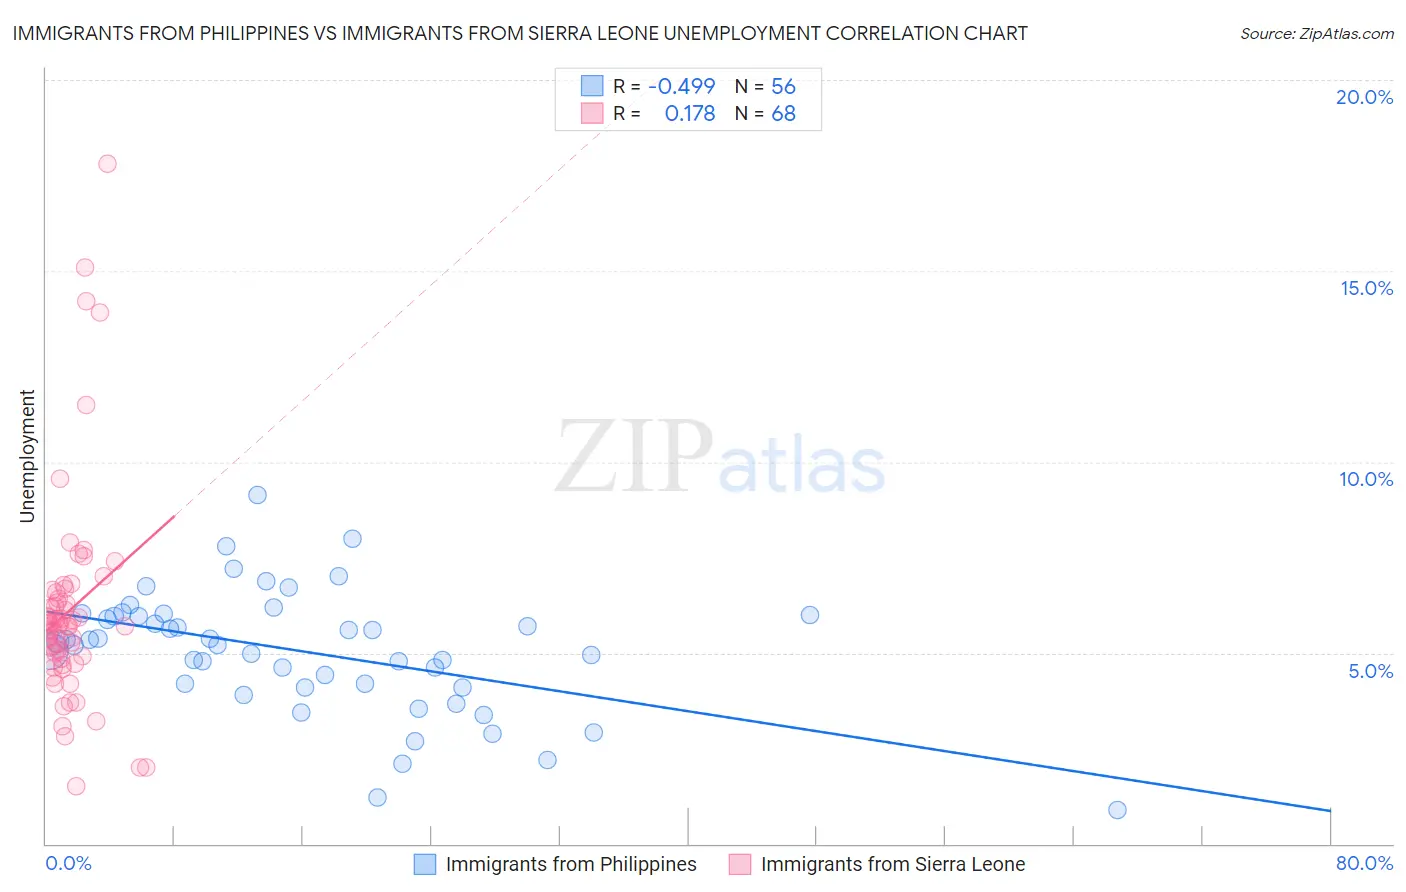
Immigrants from Philippines vs Immigrants from Sierra Leone Unemployment Correlation Chart
The statistical analysis conducted on geographies consisting of 470,568,280 people shows a moderate negative correlation between the proportion of Immigrants from Philippines and unemployment in the United States with a correlation coefficient (R) of -0.499 and weighted average of 5.4%. Similarly, the statistical analysis conducted on geographies consisting of 101,634,526 people shows a poor positive correlation between the proportion of Immigrants from Sierra Leone and unemployment in the United States with a correlation coefficient (R) of 0.178 and weighted average of 5.8%, a difference of 7.5%.
Unemployment Correlation Summary
| Measurement | Immigrants from Philippines | Immigrants from Sierra Leone |
| Minimum | 0.90% | 1.5% |
| Maximum | 9.1% | 17.8% |
| Range | 8.2% | 16.3% |
| Mean | 5.0% | 6.1% |
| Median | 5.3% | 5.7% |
| Interquartile 25% (IQ1) | 4.1% | 4.9% |
| Interquartile 75% (IQ3) | 6.0% | 6.5% |
| Interquartile Range (IQR) | 1.8% | 1.6% |
| Standard Deviation (Sample) | 1.6% | 2.8% |
| Standard Deviation (Population) | 1.6% | 2.8% |
Similar Demographics by Unemployment
Demographics Similar to Immigrants from Philippines by Unemployment
In terms of unemployment, the demographic groups most similar to Immigrants from Philippines are Iroquois (5.4%, a difference of 0.020%), Soviet Union (5.4%, a difference of 0.040%), Bangladeshi (5.4%, a difference of 0.12%), Seminole (5.4%, a difference of 0.21%), and Israeli (5.4%, a difference of 0.28%).
| Demographics | Rating | Rank | Unemployment |
| Immigrants | Costa Rica | 15.2 /100 | #214 | Poor 5.4% |
| Delaware | 14.7 /100 | #215 | Poor 5.4% |
| Immigrants | South America | 13.5 /100 | #216 | Poor 5.4% |
| Immigrants | Albania | 13.5 /100 | #217 | Poor 5.4% |
| Choctaw | 12.7 /100 | #218 | Poor 5.4% |
| Bangladeshis | 11.2 /100 | #219 | Poor 5.4% |
| Soviet Union | 10.6 /100 | #220 | Poor 5.4% |
| Immigrants | Philippines | 10.4 /100 | #221 | Poor 5.4% |
| Iroquois | 10.3 /100 | #222 | Poor 5.4% |
| Seminole | 9.2 /100 | #223 | Tragic 5.4% |
| Israelis | 8.8 /100 | #224 | Tragic 5.4% |
| South American Indians | 7.8 /100 | #225 | Tragic 5.5% |
| Samoans | 7.1 /100 | #226 | Tragic 5.5% |
| Immigrants | Lebanon | 7.0 /100 | #227 | Tragic 5.5% |
| Guamanians/Chamorros | 6.3 /100 | #228 | Tragic 5.5% |
Demographics Similar to Immigrants from Sierra Leone by Unemployment
In terms of unemployment, the demographic groups most similar to Immigrants from Sierra Leone are Immigrants from El Salvador (5.8%, a difference of 0.010%), Immigrants from Nigeria (5.8%, a difference of 0.040%), Blackfeet (5.8%, a difference of 0.090%), Mexican American Indian (5.8%, a difference of 0.11%), and Mexican (5.9%, a difference of 0.32%).
| Demographics | Rating | Rank | Unemployment |
| Immigrants | Guatemala | 0.1 /100 | #261 | Tragic 5.8% |
| Sierra Leoneans | 0.1 /100 | #262 | Tragic 5.8% |
| Salvadorans | 0.1 /100 | #263 | Tragic 5.8% |
| Immigrants | Liberia | 0.1 /100 | #264 | Tragic 5.8% |
| Nigerians | 0.1 /100 | #265 | Tragic 5.8% |
| Mexican American Indians | 0.1 /100 | #266 | Tragic 5.8% |
| Immigrants | Nigeria | 0.1 /100 | #267 | Tragic 5.8% |
| Immigrants | Sierra Leone | 0.1 /100 | #268 | Tragic 5.8% |
| Immigrants | El Salvador | 0.1 /100 | #269 | Tragic 5.8% |
| Blackfeet | 0.1 /100 | #270 | Tragic 5.8% |
| Mexicans | 0.1 /100 | #271 | Tragic 5.9% |
| Hispanics or Latinos | 0.0 /100 | #272 | Tragic 5.9% |
| Immigrants | Fiji | 0.0 /100 | #273 | Tragic 5.9% |
| Bahamians | 0.0 /100 | #274 | Tragic 5.9% |
| Immigrants | Latin America | 0.0 /100 | #275 | Tragic 5.9% |