Immigrants from Italy vs Immigrants from Sierra Leone Unemployment
COMPARE
Immigrants from Italy
Immigrants from Sierra Leone
Unemployment
Unemployment Comparison
Immigrants from Italy
Immigrants from Sierra Leone
5.1%
UNEMPLOYMENT
79.1/ 100
METRIC RATING
148th/ 347
METRIC RANK
5.8%
UNEMPLOYMENT
0.1/ 100
METRIC RATING
268th/ 347
METRIC RANK
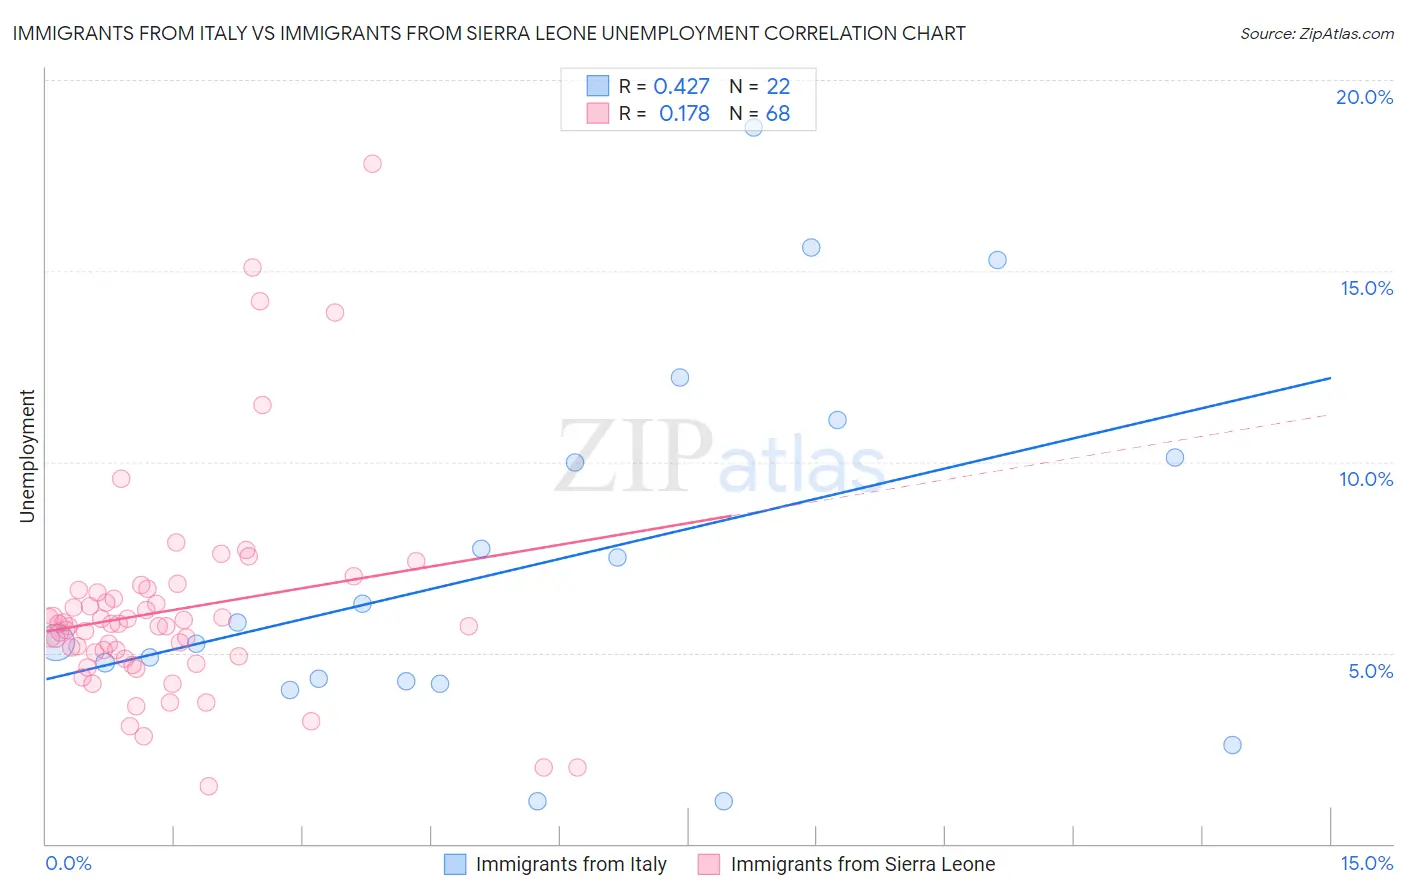
Immigrants from Italy vs Immigrants from Sierra Leone Unemployment Correlation Chart
The statistical analysis conducted on geographies consisting of 324,002,453 people shows a moderate positive correlation between the proportion of Immigrants from Italy and unemployment in the United States with a correlation coefficient (R) of 0.427 and weighted average of 5.1%. Similarly, the statistical analysis conducted on geographies consisting of 101,634,526 people shows a poor positive correlation between the proportion of Immigrants from Sierra Leone and unemployment in the United States with a correlation coefficient (R) of 0.178 and weighted average of 5.8%, a difference of 13.4%.
Unemployment Correlation Summary
| Measurement | Immigrants from Italy | Immigrants from Sierra Leone |
| Minimum | 1.1% | 1.5% |
| Maximum | 18.8% | 17.8% |
| Range | 17.7% | 16.3% |
| Mean | 7.4% | 6.1% |
| Median | 5.5% | 5.7% |
| Interquartile 25% (IQ1) | 4.3% | 4.9% |
| Interquartile 75% (IQ3) | 10.1% | 6.5% |
| Interquartile Range (IQR) | 5.8% | 1.6% |
| Standard Deviation (Sample) | 4.8% | 2.8% |
| Standard Deviation (Population) | 4.7% | 2.8% |
Similar Demographics by Unemployment
Demographics Similar to Immigrants from Italy by Unemployment
In terms of unemployment, the demographic groups most similar to Immigrants from Italy are Syrian (5.2%, a difference of 0.13%), Indian (Asian) (5.1%, a difference of 0.26%), Potawatomi (5.2%, a difference of 0.26%), Immigrants from Norway (5.1%, a difference of 0.27%), and Immigrants from Asia (5.1%, a difference of 0.27%).
| Demographics | Rating | Rank | Unemployment |
| Palestinians | 83.4 /100 | #141 | Excellent 5.1% |
| Immigrants | Pakistan | 83.2 /100 | #142 | Excellent 5.1% |
| Immigrants | Chile | 82.8 /100 | #143 | Excellent 5.1% |
| Indonesians | 82.3 /100 | #144 | Excellent 5.1% |
| Immigrants | Norway | 81.8 /100 | #145 | Excellent 5.1% |
| Immigrants | Asia | 81.8 /100 | #146 | Excellent 5.1% |
| Indians (Asian) | 81.6 /100 | #147 | Excellent 5.1% |
| Immigrants | Italy | 79.1 /100 | #148 | Good 5.1% |
| Syrians | 77.7 /100 | #149 | Good 5.2% |
| Potawatomi | 76.2 /100 | #150 | Good 5.2% |
| Immigrants | Eastern Europe | 75.3 /100 | #151 | Good 5.2% |
| Immigrants | Hong Kong | 75.2 /100 | #152 | Good 5.2% |
| Egyptians | 75.2 /100 | #153 | Good 5.2% |
| Immigrants | China | 74.7 /100 | #154 | Good 5.2% |
| Immigrants | Northern Africa | 71.3 /100 | #155 | Good 5.2% |
Demographics Similar to Immigrants from Sierra Leone by Unemployment
In terms of unemployment, the demographic groups most similar to Immigrants from Sierra Leone are Immigrants from El Salvador (5.8%, a difference of 0.010%), Immigrants from Nigeria (5.8%, a difference of 0.040%), Blackfeet (5.8%, a difference of 0.090%), Mexican American Indian (5.8%, a difference of 0.11%), and Mexican (5.9%, a difference of 0.32%).
| Demographics | Rating | Rank | Unemployment |
| Immigrants | Guatemala | 0.1 /100 | #261 | Tragic 5.8% |
| Sierra Leoneans | 0.1 /100 | #262 | Tragic 5.8% |
| Salvadorans | 0.1 /100 | #263 | Tragic 5.8% |
| Immigrants | Liberia | 0.1 /100 | #264 | Tragic 5.8% |
| Nigerians | 0.1 /100 | #265 | Tragic 5.8% |
| Mexican American Indians | 0.1 /100 | #266 | Tragic 5.8% |
| Immigrants | Nigeria | 0.1 /100 | #267 | Tragic 5.8% |
| Immigrants | Sierra Leone | 0.1 /100 | #268 | Tragic 5.8% |
| Immigrants | El Salvador | 0.1 /100 | #269 | Tragic 5.8% |
| Blackfeet | 0.1 /100 | #270 | Tragic 5.8% |
| Mexicans | 0.1 /100 | #271 | Tragic 5.9% |
| Hispanics or Latinos | 0.0 /100 | #272 | Tragic 5.9% |
| Immigrants | Fiji | 0.0 /100 | #273 | Tragic 5.9% |
| Bahamians | 0.0 /100 | #274 | Tragic 5.9% |
| Immigrants | Latin America | 0.0 /100 | #275 | Tragic 5.9% |