Immigrants from Philippines vs Immigrants from Norway Unemployment Among Ages 30 to 34 years
COMPARE
Immigrants from Philippines
Immigrants from Norway
Unemployment Among Ages 30 to 34 years
Unemployment Among Ages 30 to 34 years Comparison
Immigrants from Philippines
Immigrants from Norway
5.7%
UNEMPLOYMENT AMONG AGES 30 TO 34 YEARS
11.5/ 100
METRIC RATING
208th/ 347
METRIC RANK
5.5%
UNEMPLOYMENT AMONG AGES 30 TO 34 YEARS
36.1/ 100
METRIC RATING
188th/ 347
METRIC RANK
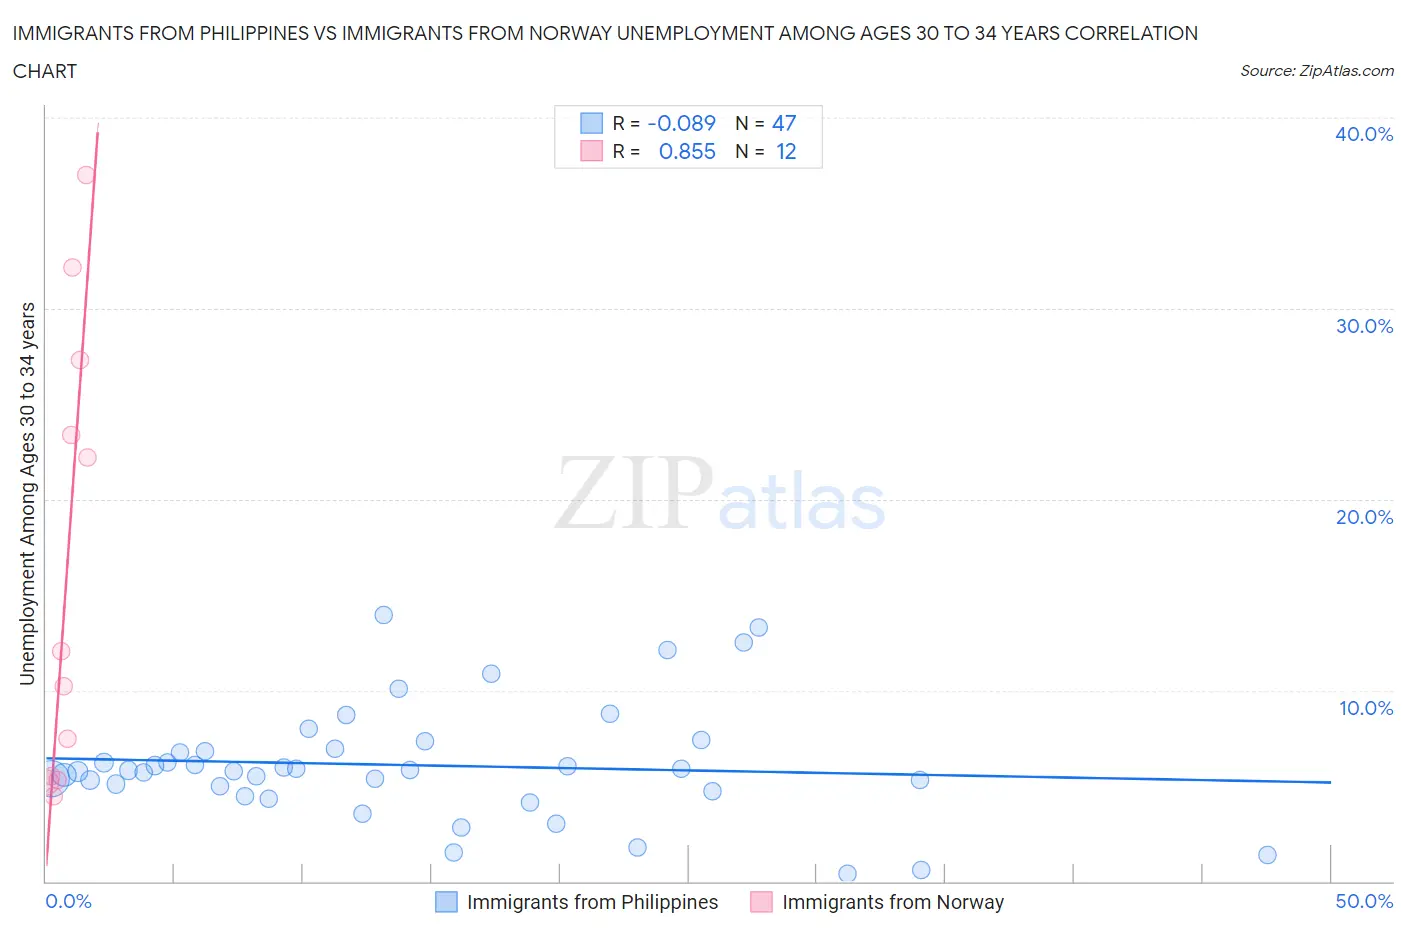
Immigrants from Philippines vs Immigrants from Norway Unemployment Among Ages 30 to 34 years Correlation Chart
The statistical analysis conducted on geographies consisting of 437,048,228 people shows a slight negative correlation between the proportion of Immigrants from Philippines and unemployment rate among population between the ages 30 and 34 in the United States with a correlation coefficient (R) of -0.089 and weighted average of 5.7%. Similarly, the statistical analysis conducted on geographies consisting of 113,369,472 people shows a very strong positive correlation between the proportion of Immigrants from Norway and unemployment rate among population between the ages 30 and 34 in the United States with a correlation coefficient (R) of 0.855 and weighted average of 5.5%, a difference of 2.5%.
Unemployment Among Ages 30 to 34 years Correlation Summary
| Measurement | Immigrants from Philippines | Immigrants from Norway |
| Minimum | 0.40% | 4.5% |
| Maximum | 14.0% | 37.0% |
| Range | 13.6% | 32.5% |
| Mean | 6.1% | 16.0% |
| Median | 5.8% | 11.1% |
| Interquartile 25% (IQ1) | 4.7% | 5.4% |
| Interquartile 75% (IQ3) | 6.9% | 25.3% |
| Interquartile Range (IQR) | 2.2% | 19.9% |
| Standard Deviation (Sample) | 3.0% | 11.8% |
| Standard Deviation (Population) | 3.0% | 11.3% |
Demographics Similar to Immigrants from Philippines and Immigrants from Norway by Unemployment Among Ages 30 to 34 years
In terms of unemployment among ages 30 to 34 years, the demographic groups most similar to Immigrants from Philippines are Israeli (5.6%, a difference of 0.21%), Alsatian (5.6%, a difference of 0.43%), Immigrants from Costa Rica (5.6%, a difference of 0.44%), Immigrants from Cameroon (5.6%, a difference of 0.93%), and Korean (5.6%, a difference of 1.2%). Similarly, the demographic groups most similar to Immigrants from Norway are Immigrants from England (5.5%, a difference of 0.030%), Immigrants from Kazakhstan (5.5%, a difference of 0.16%), Irish (5.5%, a difference of 0.37%), Moroccan (5.5%, a difference of 0.37%), and Immigrants from Africa (5.5%, a difference of 0.39%).
| Demographics | Rating | Rank | Unemployment Among Ages 30 to 34 years |
| Immigrants | Norway | 36.1 /100 | #188 | Fair 5.5% |
| Immigrants | England | 35.7 /100 | #189 | Fair 5.5% |
| Immigrants | Kazakhstan | 33.9 /100 | #190 | Fair 5.5% |
| Irish | 31.3 /100 | #191 | Fair 5.5% |
| Moroccans | 31.2 /100 | #192 | Fair 5.5% |
| Immigrants | Africa | 31.0 /100 | #193 | Fair 5.5% |
| Slavs | 30.9 /100 | #194 | Fair 5.5% |
| Finns | 30.7 /100 | #195 | Fair 5.5% |
| Immigrants | South America | 29.8 /100 | #196 | Fair 5.5% |
| Immigrants | Nicaragua | 28.9 /100 | #197 | Fair 5.5% |
| Immigrants | Afghanistan | 27.2 /100 | #198 | Fair 5.6% |
| Nicaraguans | 26.6 /100 | #199 | Fair 5.6% |
| Immigrants | Southern Europe | 25.8 /100 | #200 | Fair 5.6% |
| South American Indians | 24.4 /100 | #201 | Fair 5.6% |
| Immigrants | Germany | 22.9 /100 | #202 | Fair 5.6% |
| Koreans | 20.7 /100 | #203 | Fair 5.6% |
| Immigrants | Cameroon | 18.4 /100 | #204 | Poor 5.6% |
| Immigrants | Costa Rica | 14.4 /100 | #205 | Poor 5.6% |
| Alsatians | 14.3 /100 | #206 | Poor 5.6% |
| Israelis | 12.8 /100 | #207 | Poor 5.6% |
| Immigrants | Philippines | 11.5 /100 | #208 | Poor 5.7% |