Immigrants from Philippines vs Costa Rican Unemployment Among Ages 30 to 34 years
COMPARE
Immigrants from Philippines
Costa Rican
Unemployment Among Ages 30 to 34 years
Unemployment Among Ages 30 to 34 years Comparison
Immigrants from Philippines
Costa Ricans
5.7%
UNEMPLOYMENT AMONG AGES 30 TO 34 YEARS
11.5/ 100
METRIC RATING
208th/ 347
METRIC RANK
5.5%
UNEMPLOYMENT AMONG AGES 30 TO 34 YEARS
46.7/ 100
METRIC RATING
179th/ 347
METRIC RANK
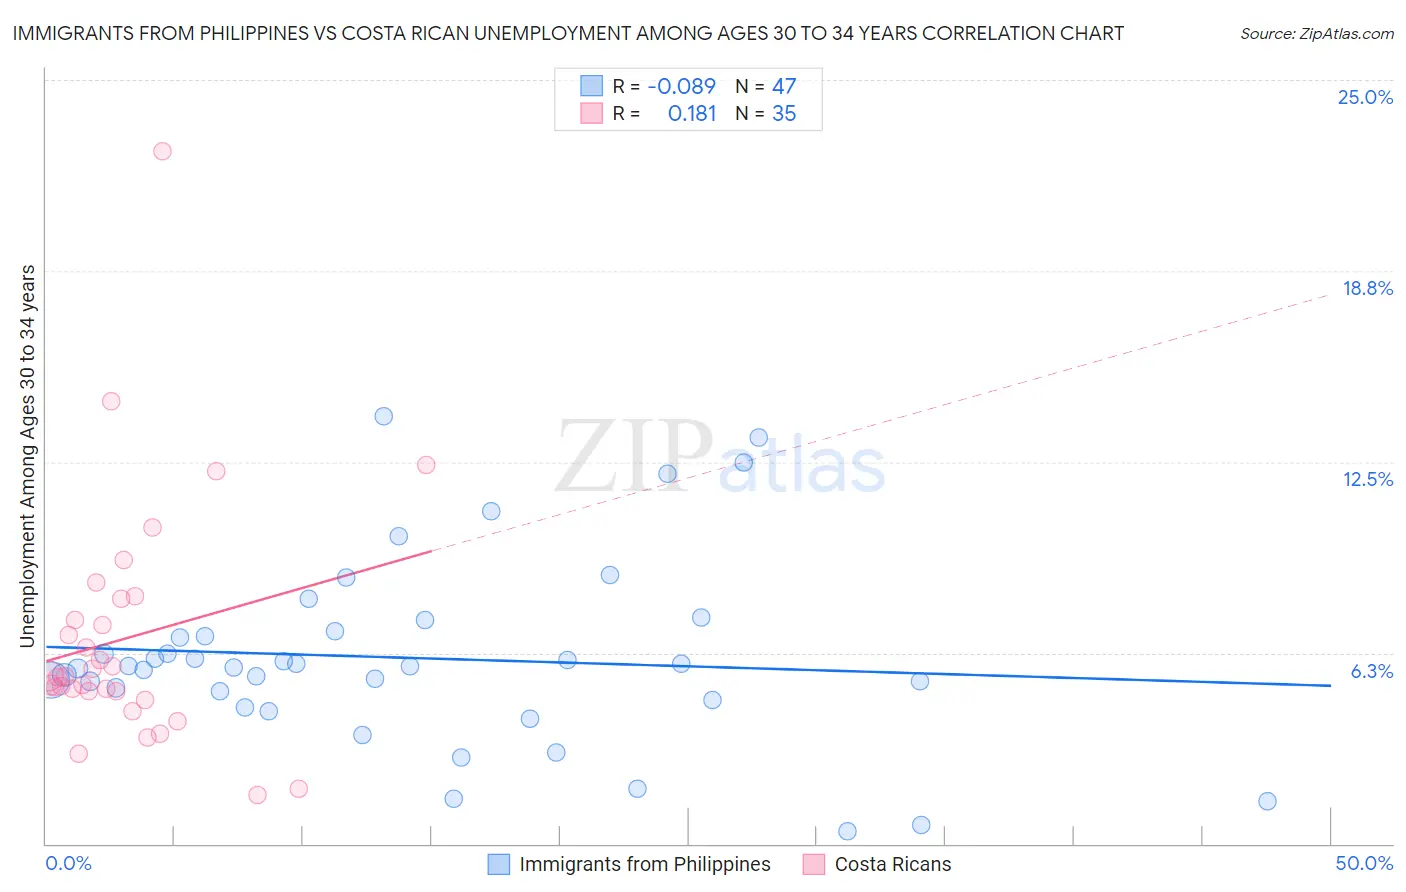
Immigrants from Philippines vs Costa Rican Unemployment Among Ages 30 to 34 years Correlation Chart
The statistical analysis conducted on geographies consisting of 437,048,228 people shows a slight negative correlation between the proportion of Immigrants from Philippines and unemployment rate among population between the ages 30 and 34 in the United States with a correlation coefficient (R) of -0.089 and weighted average of 5.7%. Similarly, the statistical analysis conducted on geographies consisting of 245,985,362 people shows a poor positive correlation between the proportion of Costa Ricans and unemployment rate among population between the ages 30 and 34 in the United States with a correlation coefficient (R) of 0.181 and weighted average of 5.5%, a difference of 3.3%.
Unemployment Among Ages 30 to 34 years Correlation Summary
| Measurement | Immigrants from Philippines | Costa Rican |
| Minimum | 0.40% | 1.6% |
| Maximum | 14.0% | 22.7% |
| Range | 13.6% | 21.1% |
| Mean | 6.1% | 6.7% |
| Median | 5.8% | 5.5% |
| Interquartile 25% (IQ1) | 4.7% | 5.0% |
| Interquartile 75% (IQ3) | 6.9% | 8.0% |
| Interquartile Range (IQR) | 2.2% | 3.0% |
| Standard Deviation (Sample) | 3.0% | 4.0% |
| Standard Deviation (Population) | 3.0% | 3.9% |
Similar Demographics by Unemployment Among Ages 30 to 34 years
Demographics Similar to Immigrants from Philippines by Unemployment Among Ages 30 to 34 years
In terms of unemployment among ages 30 to 34 years, the demographic groups most similar to Immigrants from Philippines are French (5.7%, a difference of 0.12%), Israeli (5.6%, a difference of 0.21%), Alsatian (5.6%, a difference of 0.43%), White/Caucasian (5.7%, a difference of 0.43%), and Immigrants from Costa Rica (5.6%, a difference of 0.44%).
| Demographics | Rating | Rank | Unemployment Among Ages 30 to 34 years |
| South American Indians | 24.4 /100 | #201 | Fair 5.6% |
| Immigrants | Germany | 22.9 /100 | #202 | Fair 5.6% |
| Koreans | 20.7 /100 | #203 | Fair 5.6% |
| Immigrants | Cameroon | 18.4 /100 | #204 | Poor 5.6% |
| Immigrants | Costa Rica | 14.4 /100 | #205 | Poor 5.6% |
| Alsatians | 14.3 /100 | #206 | Poor 5.6% |
| Israelis | 12.8 /100 | #207 | Poor 5.6% |
| Immigrants | Philippines | 11.5 /100 | #208 | Poor 5.7% |
| French | 10.8 /100 | #209 | Poor 5.7% |
| Whites/Caucasians | 9.2 /100 | #210 | Tragic 5.7% |
| Spanish American Indians | 8.7 /100 | #211 | Tragic 5.7% |
| Scotch-Irish | 8.6 /100 | #212 | Tragic 5.7% |
| Immigrants | Immigrants | 7.1 /100 | #213 | Tragic 5.7% |
| Immigrants | Panama | 5.9 /100 | #214 | Tragic 5.7% |
| Immigrants | Cambodia | 5.8 /100 | #215 | Tragic 5.7% |
Demographics Similar to Costa Ricans by Unemployment Among Ages 30 to 34 years
In terms of unemployment among ages 30 to 34 years, the demographic groups most similar to Costa Ricans are Macedonian (5.5%, a difference of 0.020%), Immigrants from Ukraine (5.5%, a difference of 0.070%), Immigrants from Peru (5.5%, a difference of 0.090%), Italian (5.5%, a difference of 0.090%), and Afghan (5.5%, a difference of 0.20%).
| Demographics | Rating | Rank | Unemployment Among Ages 30 to 34 years |
| Immigrants | Austria | 51.3 /100 | #172 | Average 5.5% |
| Peruvians | 50.2 /100 | #173 | Average 5.5% |
| Immigrants | Laos | 50.0 /100 | #174 | Average 5.5% |
| Afghans | 49.6 /100 | #175 | Average 5.5% |
| Immigrants | Peru | 48.0 /100 | #176 | Average 5.5% |
| Immigrants | Ukraine | 47.7 /100 | #177 | Average 5.5% |
| Macedonians | 47.1 /100 | #178 | Average 5.5% |
| Costa Ricans | 46.7 /100 | #179 | Average 5.5% |
| Italians | 45.5 /100 | #180 | Average 5.5% |
| Immigrants | Lebanon | 43.5 /100 | #181 | Average 5.5% |
| Immigrants | Denmark | 43.4 /100 | #182 | Average 5.5% |
| Hungarians | 43.1 /100 | #183 | Average 5.5% |
| Malaysians | 41.8 /100 | #184 | Average 5.5% |
| Immigrants | Western Europe | 39.1 /100 | #185 | Fair 5.5% |
| Canadians | 38.2 /100 | #186 | Fair 5.5% |