Immigrants from Philippines vs Bolivian Unemployment Among Ages 30 to 34 years
COMPARE
Immigrants from Philippines
Bolivian
Unemployment Among Ages 30 to 34 years
Unemployment Among Ages 30 to 34 years Comparison
Immigrants from Philippines
Bolivians
5.7%
UNEMPLOYMENT AMONG AGES 30 TO 34 YEARS
11.5/ 100
METRIC RATING
208th/ 347
METRIC RANK
4.9%
UNEMPLOYMENT AMONG AGES 30 TO 34 YEARS
99.8/ 100
METRIC RATING
18th/ 347
METRIC RANK
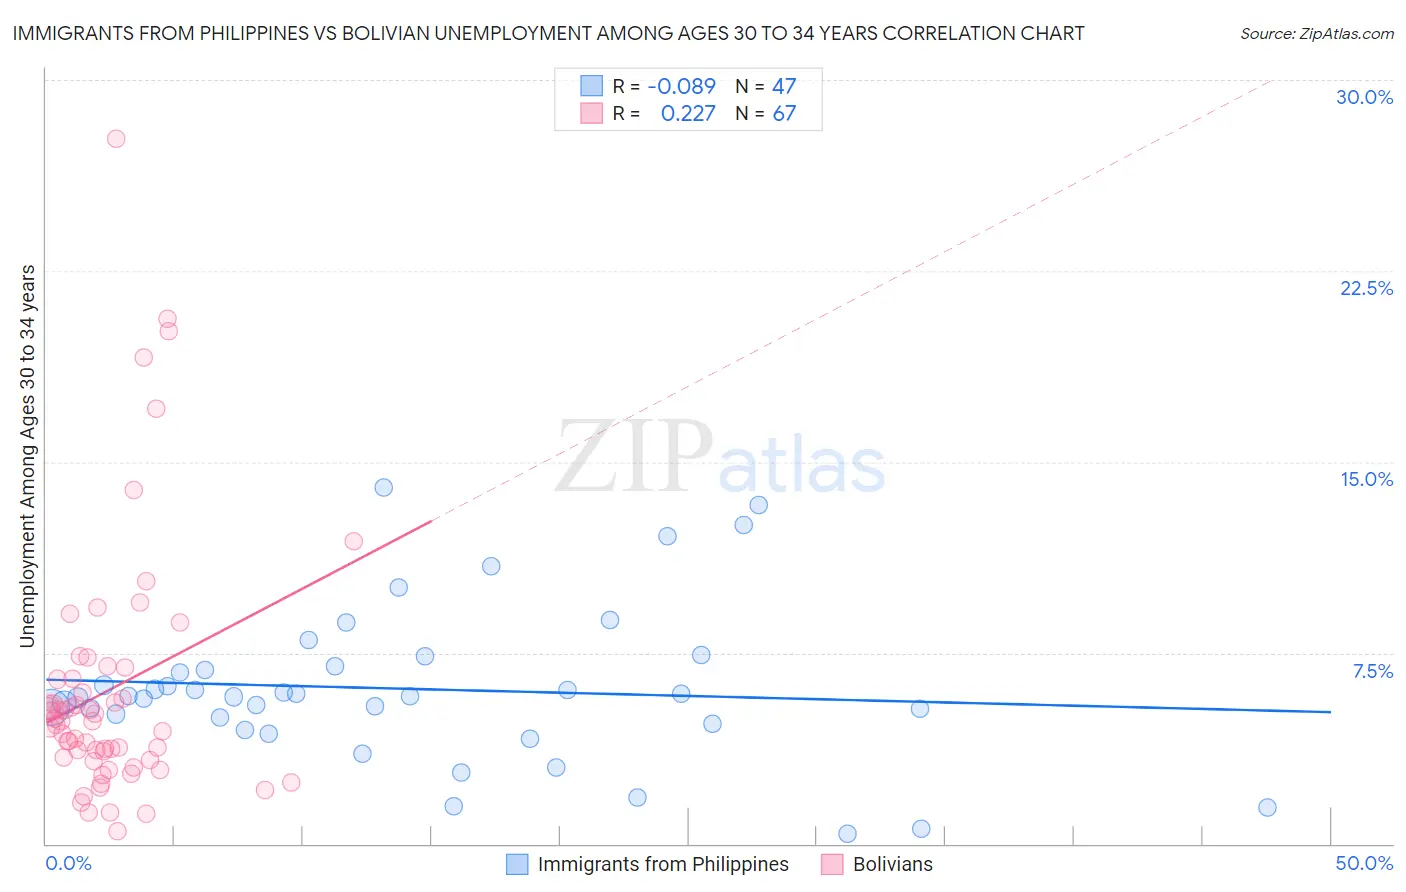
Immigrants from Philippines vs Bolivian Unemployment Among Ages 30 to 34 years Correlation Chart
The statistical analysis conducted on geographies consisting of 437,048,228 people shows a slight negative correlation between the proportion of Immigrants from Philippines and unemployment rate among population between the ages 30 and 34 in the United States with a correlation coefficient (R) of -0.089 and weighted average of 5.7%. Similarly, the statistical analysis conducted on geographies consisting of 180,156,446 people shows a weak positive correlation between the proportion of Bolivians and unemployment rate among population between the ages 30 and 34 in the United States with a correlation coefficient (R) of 0.227 and weighted average of 4.9%, a difference of 16.4%.
Unemployment Among Ages 30 to 34 years Correlation Summary
| Measurement | Immigrants from Philippines | Bolivian |
| Minimum | 0.40% | 0.50% |
| Maximum | 14.0% | 27.7% |
| Range | 13.6% | 27.2% |
| Mean | 6.1% | 6.0% |
| Median | 5.8% | 4.8% |
| Interquartile 25% (IQ1) | 4.7% | 3.3% |
| Interquartile 75% (IQ3) | 6.9% | 6.5% |
| Interquartile Range (IQR) | 2.2% | 3.2% |
| Standard Deviation (Sample) | 3.0% | 5.0% |
| Standard Deviation (Population) | 3.0% | 5.0% |
Similar Demographics by Unemployment Among Ages 30 to 34 years
Demographics Similar to Immigrants from Philippines by Unemployment Among Ages 30 to 34 years
In terms of unemployment among ages 30 to 34 years, the demographic groups most similar to Immigrants from Philippines are French (5.7%, a difference of 0.12%), Israeli (5.6%, a difference of 0.21%), Alsatian (5.6%, a difference of 0.43%), White/Caucasian (5.7%, a difference of 0.43%), and Immigrants from Costa Rica (5.6%, a difference of 0.44%).
| Demographics | Rating | Rank | Unemployment Among Ages 30 to 34 years |
| South American Indians | 24.4 /100 | #201 | Fair 5.6% |
| Immigrants | Germany | 22.9 /100 | #202 | Fair 5.6% |
| Koreans | 20.7 /100 | #203 | Fair 5.6% |
| Immigrants | Cameroon | 18.4 /100 | #204 | Poor 5.6% |
| Immigrants | Costa Rica | 14.4 /100 | #205 | Poor 5.6% |
| Alsatians | 14.3 /100 | #206 | Poor 5.6% |
| Israelis | 12.8 /100 | #207 | Poor 5.6% |
| Immigrants | Philippines | 11.5 /100 | #208 | Poor 5.7% |
| French | 10.8 /100 | #209 | Poor 5.7% |
| Whites/Caucasians | 9.2 /100 | #210 | Tragic 5.7% |
| Spanish American Indians | 8.7 /100 | #211 | Tragic 5.7% |
| Scotch-Irish | 8.6 /100 | #212 | Tragic 5.7% |
| Immigrants | Immigrants | 7.1 /100 | #213 | Tragic 5.7% |
| Immigrants | Panama | 5.9 /100 | #214 | Tragic 5.7% |
| Immigrants | Cambodia | 5.8 /100 | #215 | Tragic 5.7% |
Demographics Similar to Bolivians by Unemployment Among Ages 30 to 34 years
In terms of unemployment among ages 30 to 34 years, the demographic groups most similar to Bolivians are Immigrants from Sudan (4.9%, a difference of 0.060%), Immigrants from Taiwan (4.9%, a difference of 0.080%), Ethiopian (4.9%, a difference of 0.090%), Immigrants from South Central Asia (4.9%, a difference of 0.30%), and Immigrants from Bulgaria (4.8%, a difference of 0.40%).
| Demographics | Rating | Rank | Unemployment Among Ages 30 to 34 years |
| Immigrants | Bolivia | 99.9 /100 | #11 | Exceptional 4.8% |
| Filipinos | 99.9 /100 | #12 | Exceptional 4.8% |
| Cambodians | 99.9 /100 | #13 | Exceptional 4.8% |
| Luxembourgers | 99.9 /100 | #14 | Exceptional 4.8% |
| Okinawans | 99.9 /100 | #15 | Exceptional 4.8% |
| Zimbabweans | 99.9 /100 | #16 | Exceptional 4.8% |
| Immigrants | Bulgaria | 99.9 /100 | #17 | Exceptional 4.8% |
| Bolivians | 99.8 /100 | #18 | Exceptional 4.9% |
| Immigrants | Sudan | 99.8 /100 | #19 | Exceptional 4.9% |
| Immigrants | Taiwan | 99.8 /100 | #20 | Exceptional 4.9% |
| Ethiopians | 99.8 /100 | #21 | Exceptional 4.9% |
| Immigrants | South Central Asia | 99.8 /100 | #22 | Exceptional 4.9% |
| Hmong | 99.8 /100 | #23 | Exceptional 4.9% |
| Ugandans | 99.7 /100 | #24 | Exceptional 4.9% |
| Immigrants | Singapore | 99.5 /100 | #25 | Exceptional 5.0% |