Immigrants from Northern Europe vs Crow Male Unemployment
COMPARE
Immigrants from Northern Europe
Crow
Male Unemployment
Male Unemployment Comparison
Immigrants from Northern Europe
Crow
5.0%
MALE UNEMPLOYMENT
96.4/ 100
METRIC RATING
78th/ 347
METRIC RANK
10.6%
MALE UNEMPLOYMENT
0.0/ 100
METRIC RATING
343rd/ 347
METRIC RANK
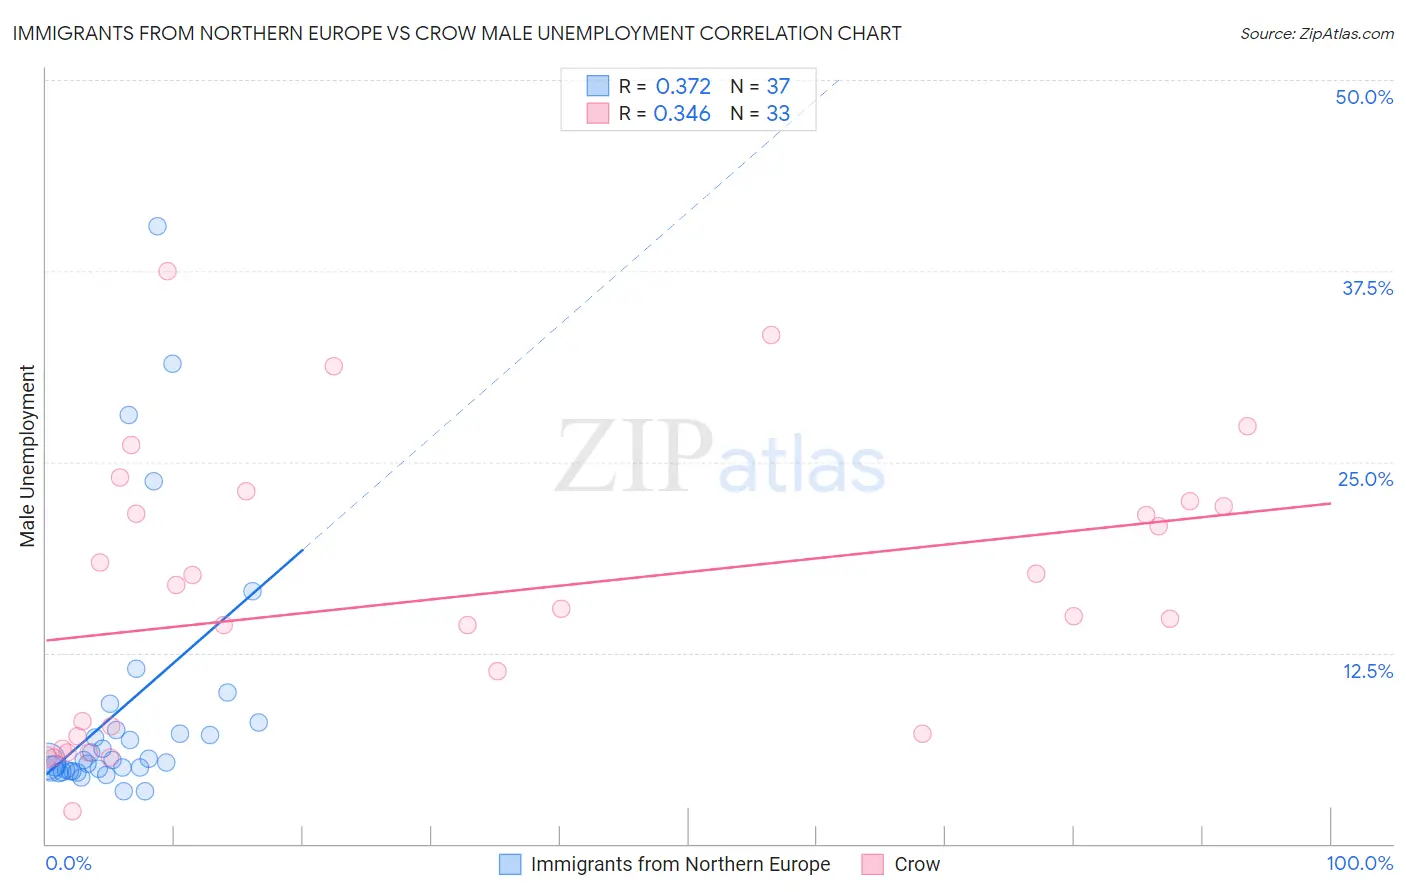
Immigrants from Northern Europe vs Crow Male Unemployment Correlation Chart
The statistical analysis conducted on geographies consisting of 473,701,130 people shows a mild positive correlation between the proportion of Immigrants from Northern Europe and unemployment rate among males in the United States with a correlation coefficient (R) of 0.372 and weighted average of 5.0%. Similarly, the statistical analysis conducted on geographies consisting of 59,099,043 people shows a mild positive correlation between the proportion of Crow and unemployment rate among males in the United States with a correlation coefficient (R) of 0.346 and weighted average of 10.6%, a difference of 110.5%.
Male Unemployment Correlation Summary
| Measurement | Immigrants from Northern Europe | Crow |
| Minimum | 3.4% | 2.1% |
| Maximum | 40.4% | 37.5% |
| Range | 37.0% | 35.4% |
| Mean | 8.9% | 16.2% |
| Median | 5.5% | 15.4% |
| Interquartile 25% (IQ1) | 4.8% | 7.1% |
| Interquartile 75% (IQ3) | 7.7% | 22.3% |
| Interquartile Range (IQR) | 2.9% | 15.1% |
| Standard Deviation (Sample) | 8.4% | 9.1% |
| Standard Deviation (Population) | 8.3% | 9.0% |
Similar Demographics by Male Unemployment
Demographics Similar to Immigrants from Northern Europe by Male Unemployment
In terms of male unemployment, the demographic groups most similar to Immigrants from Northern Europe are Iranian (5.0%, a difference of 0.010%), South African (5.0%, a difference of 0.010%), Immigrants from Sudan (5.0%, a difference of 0.060%), Argentinean (5.0%, a difference of 0.060%), and French (5.0%, a difference of 0.070%).
| Demographics | Rating | Rank | Male Unemployment |
| New Zealanders | 97.3 /100 | #71 | Exceptional 5.0% |
| Immigrants | South Africa | 97.1 /100 | #72 | Exceptional 5.0% |
| Greeks | 97.0 /100 | #73 | Exceptional 5.0% |
| Immigrants | North America | 96.9 /100 | #74 | Exceptional 5.0% |
| Assyrians/Chaldeans/Syriacs | 96.9 /100 | #75 | Exceptional 5.0% |
| Immigrants | Sudan | 96.5 /100 | #76 | Exceptional 5.0% |
| Iranians | 96.4 /100 | #77 | Exceptional 5.0% |
| Immigrants | Northern Europe | 96.4 /100 | #78 | Exceptional 5.0% |
| South Africans | 96.4 /100 | #79 | Exceptional 5.0% |
| Argentineans | 96.2 /100 | #80 | Exceptional 5.0% |
| French | 96.2 /100 | #81 | Exceptional 5.0% |
| Chileans | 96.2 /100 | #82 | Exceptional 5.0% |
| Immigrants | Eritrea | 96.0 /100 | #83 | Exceptional 5.0% |
| Serbians | 95.7 /100 | #84 | Exceptional 5.1% |
| Immigrants | North Macedonia | 95.6 /100 | #85 | Exceptional 5.1% |
Demographics Similar to Crow by Male Unemployment
In terms of male unemployment, the demographic groups most similar to Crow are Hopi (10.8%, a difference of 1.7%), Arapaho (11.0%, a difference of 3.7%), Tohono O'odham (10.2%, a difference of 4.4%), Navajo (9.8%, a difference of 7.9%), and Alaskan Athabascan (9.8%, a difference of 8.2%).
| Demographics | Rating | Rank | Male Unemployment |
| Sioux | 0.0 /100 | #333 | Tragic 8.4% |
| Tsimshian | 0.0 /100 | #334 | Tragic 8.5% |
| Pueblo | 0.0 /100 | #335 | Tragic 8.5% |
| Yuman | 0.0 /100 | #336 | Tragic 8.6% |
| Puerto Ricans | 0.0 /100 | #337 | Tragic 8.6% |
| Apache | 0.0 /100 | #338 | Tragic 8.6% |
| Cheyenne | 0.0 /100 | #339 | Tragic 9.8% |
| Alaskan Athabascans | 0.0 /100 | #340 | Tragic 9.8% |
| Navajo | 0.0 /100 | #341 | Tragic 9.8% |
| Tohono O'odham | 0.0 /100 | #342 | Tragic 10.2% |
| Crow | 0.0 /100 | #343 | Tragic 10.6% |
| Hopi | 0.0 /100 | #344 | Tragic 10.8% |
| Arapaho | 0.0 /100 | #345 | Tragic 11.0% |
| Inupiat | 0.0 /100 | #346 | Tragic 12.1% |
| Yup'ik | 0.0 /100 | #347 | Tragic 16.4% |