Immigrants from Guatemala vs Crow Male Unemployment
COMPARE
Immigrants from Guatemala
Crow
Male Unemployment
Male Unemployment Comparison
Immigrants from Guatemala
Crow
5.6%
MALE UNEMPLOYMENT
1.1/ 100
METRIC RATING
239th/ 347
METRIC RANK
10.6%
MALE UNEMPLOYMENT
0.0/ 100
METRIC RATING
343rd/ 347
METRIC RANK
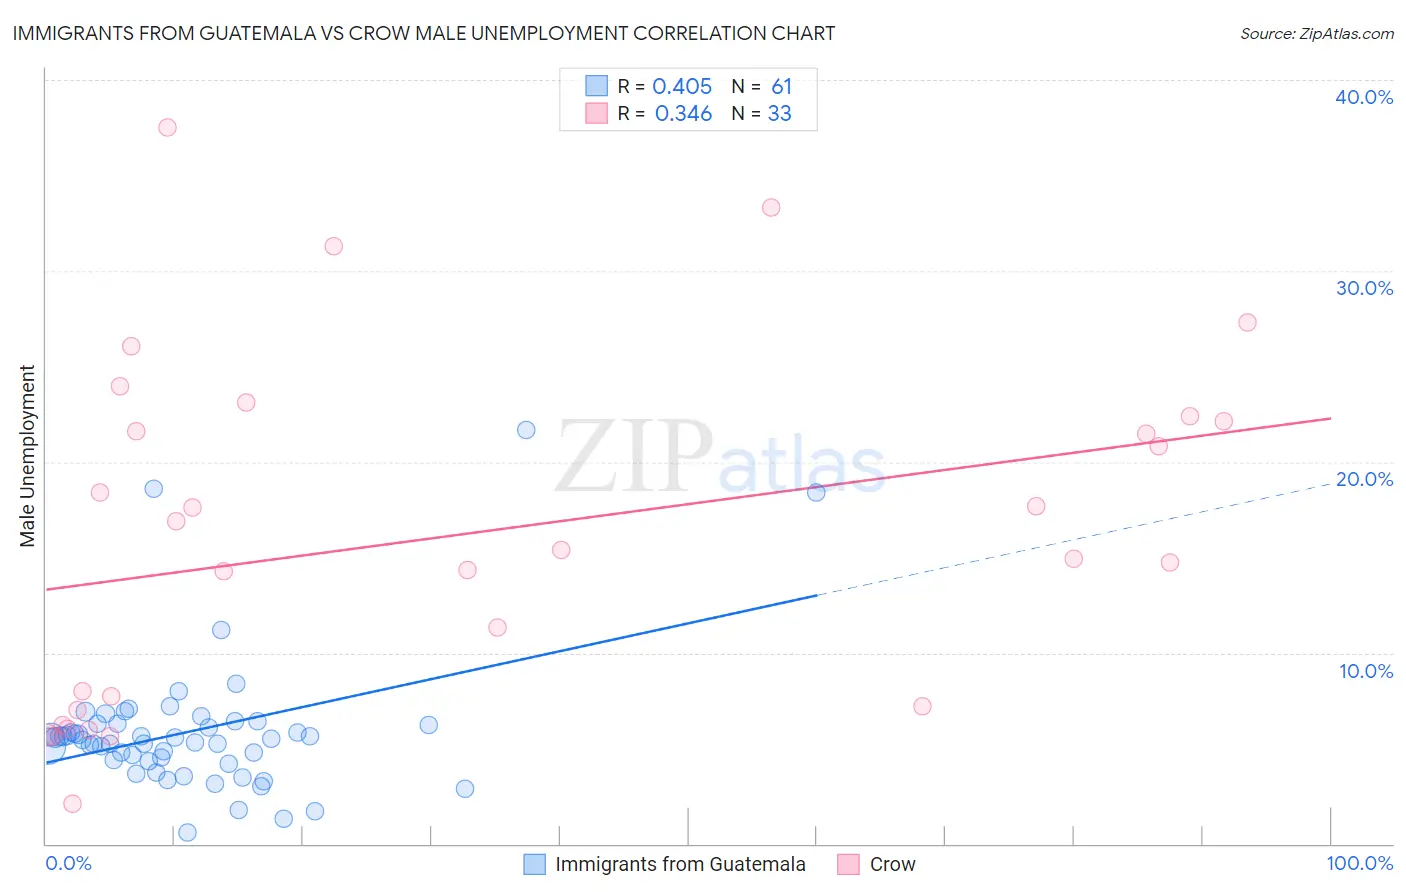
Immigrants from Guatemala vs Crow Male Unemployment Correlation Chart
The statistical analysis conducted on geographies consisting of 375,961,027 people shows a moderate positive correlation between the proportion of Immigrants from Guatemala and unemployment rate among males in the United States with a correlation coefficient (R) of 0.405 and weighted average of 5.6%. Similarly, the statistical analysis conducted on geographies consisting of 59,099,043 people shows a mild positive correlation between the proportion of Crow and unemployment rate among males in the United States with a correlation coefficient (R) of 0.346 and weighted average of 10.6%, a difference of 88.0%.
Male Unemployment Correlation Summary
| Measurement | Immigrants from Guatemala | Crow |
| Minimum | 0.60% | 2.1% |
| Maximum | 21.7% | 37.5% |
| Range | 21.1% | 35.4% |
| Mean | 5.9% | 16.2% |
| Median | 5.5% | 15.4% |
| Interquartile 25% (IQ1) | 4.3% | 7.1% |
| Interquartile 75% (IQ3) | 6.3% | 22.3% |
| Interquartile Range (IQR) | 1.9% | 15.1% |
| Standard Deviation (Sample) | 3.6% | 9.1% |
| Standard Deviation (Population) | 3.6% | 9.0% |
Similar Demographics by Male Unemployment
Demographics Similar to Immigrants from Guatemala by Male Unemployment
In terms of male unemployment, the demographic groups most similar to Immigrants from Guatemala are Native Hawaiian (5.6%, a difference of 0.0%), Honduran (5.6%, a difference of 0.050%), Immigrants from Cameroon (5.6%, a difference of 0.070%), Salvadoran (5.7%, a difference of 0.11%), and Guatemalan (5.6%, a difference of 0.14%).
| Demographics | Rating | Rank | Male Unemployment |
| Moroccans | 1.6 /100 | #232 | Tragic 5.6% |
| Somalis | 1.5 /100 | #233 | Tragic 5.6% |
| Immigrants | Somalia | 1.5 /100 | #234 | Tragic 5.6% |
| Immigrants | Honduras | 1.5 /100 | #235 | Tragic 5.6% |
| Guatemalans | 1.2 /100 | #236 | Tragic 5.6% |
| Hondurans | 1.1 /100 | #237 | Tragic 5.6% |
| Native Hawaiians | 1.1 /100 | #238 | Tragic 5.6% |
| Immigrants | Guatemala | 1.1 /100 | #239 | Tragic 5.6% |
| Immigrants | Cameroon | 1.0 /100 | #240 | Tragic 5.6% |
| Salvadorans | 1.0 /100 | #241 | Tragic 5.7% |
| Ottawa | 0.9 /100 | #242 | Tragic 5.7% |
| Bangladeshis | 0.8 /100 | #243 | Tragic 5.7% |
| Immigrants | El Salvador | 0.7 /100 | #244 | Tragic 5.7% |
| Yaqui | 0.7 /100 | #245 | Tragic 5.7% |
| Iroquois | 0.6 /100 | #246 | Tragic 5.7% |
Demographics Similar to Crow by Male Unemployment
In terms of male unemployment, the demographic groups most similar to Crow are Hopi (10.8%, a difference of 1.7%), Arapaho (11.0%, a difference of 3.7%), Tohono O'odham (10.2%, a difference of 4.4%), Navajo (9.8%, a difference of 7.9%), and Alaskan Athabascan (9.8%, a difference of 8.2%).
| Demographics | Rating | Rank | Male Unemployment |
| Sioux | 0.0 /100 | #333 | Tragic 8.4% |
| Tsimshian | 0.0 /100 | #334 | Tragic 8.5% |
| Pueblo | 0.0 /100 | #335 | Tragic 8.5% |
| Yuman | 0.0 /100 | #336 | Tragic 8.6% |
| Puerto Ricans | 0.0 /100 | #337 | Tragic 8.6% |
| Apache | 0.0 /100 | #338 | Tragic 8.6% |
| Cheyenne | 0.0 /100 | #339 | Tragic 9.8% |
| Alaskan Athabascans | 0.0 /100 | #340 | Tragic 9.8% |
| Navajo | 0.0 /100 | #341 | Tragic 9.8% |
| Tohono O'odham | 0.0 /100 | #342 | Tragic 10.2% |
| Crow | 0.0 /100 | #343 | Tragic 10.6% |
| Hopi | 0.0 /100 | #344 | Tragic 10.8% |
| Arapaho | 0.0 /100 | #345 | Tragic 11.0% |
| Inupiat | 0.0 /100 | #346 | Tragic 12.1% |
| Yup'ik | 0.0 /100 | #347 | Tragic 16.4% |