Immigrants from Northern Europe vs Immigrants from Thailand Male Unemployment
COMPARE
Immigrants from Northern Europe
Immigrants from Thailand
Male Unemployment
Male Unemployment Comparison
Immigrants from Northern Europe
Immigrants from Thailand
5.0%
MALE UNEMPLOYMENT
96.4/ 100
METRIC RATING
78th/ 347
METRIC RANK
5.4%
MALE UNEMPLOYMENT
14.7/ 100
METRIC RATING
198th/ 347
METRIC RANK
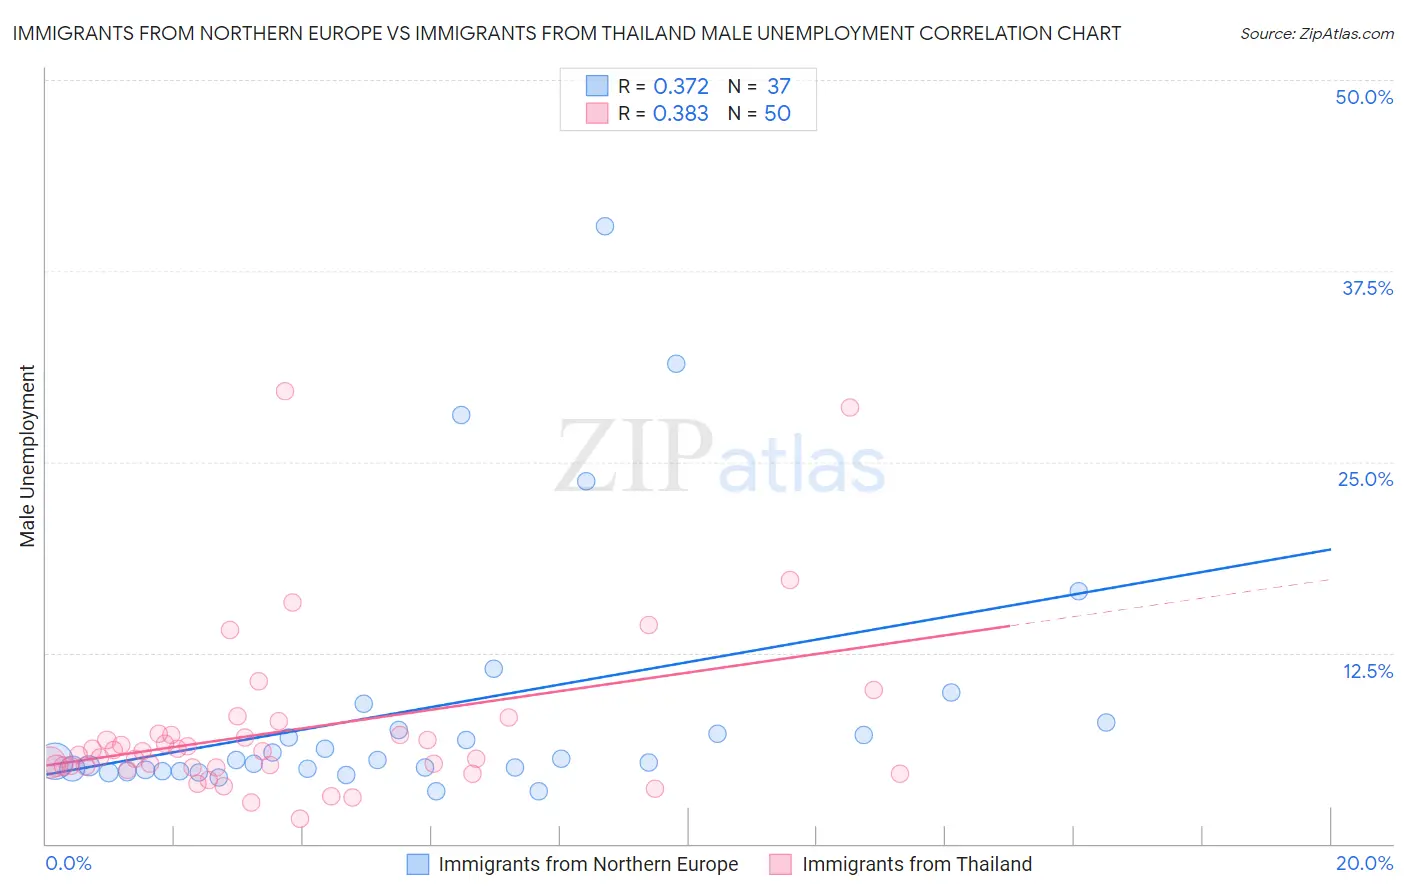
Immigrants from Northern Europe vs Immigrants from Thailand Male Unemployment Correlation Chart
The statistical analysis conducted on geographies consisting of 473,701,130 people shows a mild positive correlation between the proportion of Immigrants from Northern Europe and unemployment rate among males in the United States with a correlation coefficient (R) of 0.372 and weighted average of 5.0%. Similarly, the statistical analysis conducted on geographies consisting of 316,225,020 people shows a mild positive correlation between the proportion of Immigrants from Thailand and unemployment rate among males in the United States with a correlation coefficient (R) of 0.383 and weighted average of 5.4%, a difference of 7.7%.
Male Unemployment Correlation Summary
| Measurement | Immigrants from Northern Europe | Immigrants from Thailand |
| Minimum | 3.4% | 1.6% |
| Maximum | 40.4% | 29.6% |
| Range | 37.0% | 28.0% |
| Mean | 8.9% | 7.4% |
| Median | 5.5% | 5.9% |
| Interquartile 25% (IQ1) | 4.8% | 5.0% |
| Interquartile 75% (IQ3) | 7.7% | 7.2% |
| Interquartile Range (IQR) | 2.9% | 2.2% |
| Standard Deviation (Sample) | 8.4% | 5.5% |
| Standard Deviation (Population) | 8.3% | 5.4% |
Similar Demographics by Male Unemployment
Demographics Similar to Immigrants from Northern Europe by Male Unemployment
In terms of male unemployment, the demographic groups most similar to Immigrants from Northern Europe are Iranian (5.0%, a difference of 0.010%), South African (5.0%, a difference of 0.010%), Immigrants from Sudan (5.0%, a difference of 0.060%), Argentinean (5.0%, a difference of 0.060%), and French (5.0%, a difference of 0.070%).
| Demographics | Rating | Rank | Male Unemployment |
| New Zealanders | 97.3 /100 | #71 | Exceptional 5.0% |
| Immigrants | South Africa | 97.1 /100 | #72 | Exceptional 5.0% |
| Greeks | 97.0 /100 | #73 | Exceptional 5.0% |
| Immigrants | North America | 96.9 /100 | #74 | Exceptional 5.0% |
| Assyrians/Chaldeans/Syriacs | 96.9 /100 | #75 | Exceptional 5.0% |
| Immigrants | Sudan | 96.5 /100 | #76 | Exceptional 5.0% |
| Iranians | 96.4 /100 | #77 | Exceptional 5.0% |
| Immigrants | Northern Europe | 96.4 /100 | #78 | Exceptional 5.0% |
| South Africans | 96.4 /100 | #79 | Exceptional 5.0% |
| Argentineans | 96.2 /100 | #80 | Exceptional 5.0% |
| French | 96.2 /100 | #81 | Exceptional 5.0% |
| Chileans | 96.2 /100 | #82 | Exceptional 5.0% |
| Immigrants | Eritrea | 96.0 /100 | #83 | Exceptional 5.0% |
| Serbians | 95.7 /100 | #84 | Exceptional 5.1% |
| Immigrants | North Macedonia | 95.6 /100 | #85 | Exceptional 5.1% |
Demographics Similar to Immigrants from Thailand by Male Unemployment
In terms of male unemployment, the demographic groups most similar to Immigrants from Thailand are Immigrants from Greece (5.4%, a difference of 0.020%), Immigrants from Zaire (5.4%, a difference of 0.12%), Immigrants from Philippines (5.4%, a difference of 0.15%), Nonimmigrants (5.4%, a difference of 0.19%), and Immigrants from Laos (5.4%, a difference of 0.20%).
| Demographics | Rating | Rank | Male Unemployment |
| Immigrants | South Eastern Asia | 28.2 /100 | #191 | Fair 5.4% |
| Immigrants | Belarus | 26.0 /100 | #192 | Fair 5.4% |
| Immigrants | Israel | 25.2 /100 | #193 | Fair 5.4% |
| Spanish | 19.7 /100 | #194 | Poor 5.4% |
| Immigrants | Southern Europe | 17.7 /100 | #195 | Poor 5.4% |
| Albanians | 17.3 /100 | #196 | Poor 5.4% |
| Alsatians | 16.7 /100 | #197 | Poor 5.4% |
| Immigrants | Thailand | 14.7 /100 | #198 | Poor 5.4% |
| Immigrants | Greece | 14.5 /100 | #199 | Poor 5.4% |
| Immigrants | Zaire | 13.7 /100 | #200 | Poor 5.4% |
| Immigrants | Philippines | 13.5 /100 | #201 | Poor 5.4% |
| Immigrants | Nonimmigrants | 13.1 /100 | #202 | Poor 5.4% |
| Immigrants | Laos | 13.0 /100 | #203 | Poor 5.4% |
| Guamanians/Chamorros | 12.3 /100 | #204 | Poor 5.4% |
| Immigrants | Costa Rica | 11.4 /100 | #205 | Poor 5.5% |