Immigrants from Kuwait vs Immigrants from Spain Unemployment Among Women with Children Under 6 years
COMPARE
Immigrants from Kuwait
Immigrants from Spain
Unemployment Among Women with Children Under 6 years
Unemployment Among Women with Children Under 6 years Comparison
Immigrants from Kuwait
Immigrants from Spain
6.9%
UNEMPLOYMENT AMONG WOMEN WITH CHILDREN UNDER 6 YEARS
99.7/ 100
METRIC RATING
65th/ 347
METRIC RANK
7.1%
UNEMPLOYMENT AMONG WOMEN WITH CHILDREN UNDER 6 YEARS
98.2/ 100
METRIC RATING
90th/ 347
METRIC RANK
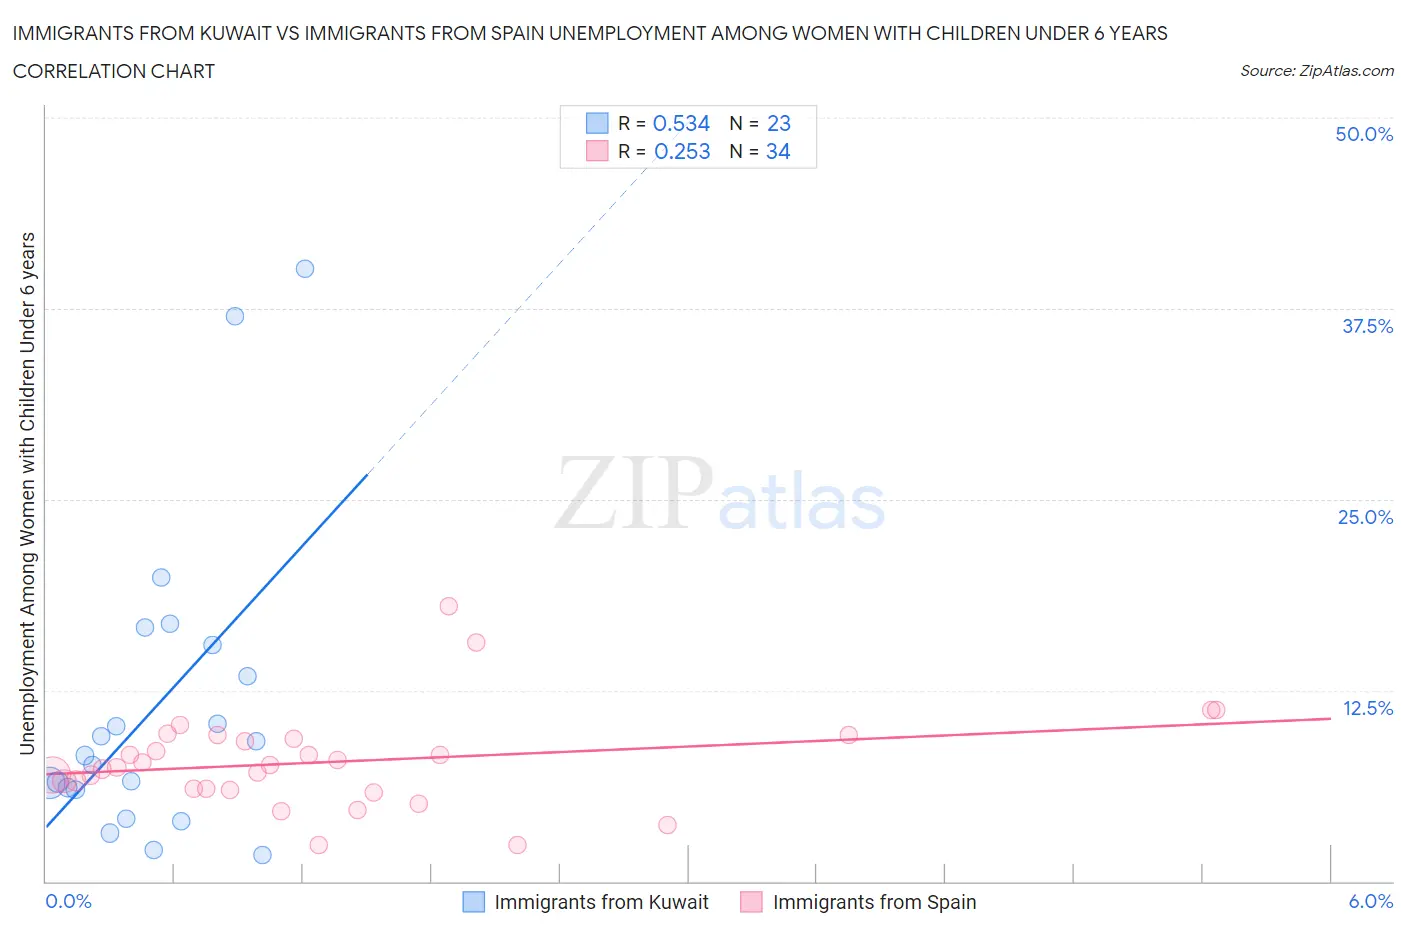
Immigrants from Kuwait vs Immigrants from Spain Unemployment Among Women with Children Under 6 years Correlation Chart
The statistical analysis conducted on geographies consisting of 121,724,889 people shows a substantial positive correlation between the proportion of Immigrants from Kuwait and unemployment rate among women with children under the age of 6 in the United States with a correlation coefficient (R) of 0.534 and weighted average of 6.9%. Similarly, the statistical analysis conducted on geographies consisting of 198,053,319 people shows a weak positive correlation between the proportion of Immigrants from Spain and unemployment rate among women with children under the age of 6 in the United States with a correlation coefficient (R) of 0.253 and weighted average of 7.1%, a difference of 3.0%.
Unemployment Among Women with Children Under 6 years Correlation Summary
| Measurement | Immigrants from Kuwait | Immigrants from Spain |
| Minimum | 1.7% | 2.4% |
| Maximum | 40.1% | 18.0% |
| Range | 38.4% | 15.6% |
| Mean | 11.3% | 7.8% |
| Median | 8.2% | 7.5% |
| Interquartile 25% (IQ1) | 6.0% | 6.0% |
| Interquartile 75% (IQ3) | 15.5% | 9.3% |
| Interquartile Range (IQR) | 9.5% | 3.3% |
| Standard Deviation (Sample) | 9.9% | 3.2% |
| Standard Deviation (Population) | 9.7% | 3.1% |
Similar Demographics by Unemployment Among Women with Children Under 6 years
Demographics Similar to Immigrants from Kuwait by Unemployment Among Women with Children Under 6 years
In terms of unemployment among women with children under 6 years, the demographic groups most similar to Immigrants from Kuwait are Tongan (6.9%, a difference of 0.15%), Immigrants from Belgium (6.9%, a difference of 0.22%), Maltese (6.9%, a difference of 0.25%), Somali (6.9%, a difference of 0.29%), and Immigrants from France (6.9%, a difference of 0.33%).
| Demographics | Rating | Rank | Unemployment Among Women with Children Under 6 years |
| Immigrants | Turkey | 99.8 /100 | #58 | Exceptional 6.9% |
| Immigrants | Serbia | 99.8 /100 | #59 | Exceptional 6.9% |
| Immigrants | Sri Lanka | 99.8 /100 | #60 | Exceptional 6.9% |
| Immigrants | France | 99.7 /100 | #61 | Exceptional 6.9% |
| Somalis | 99.7 /100 | #62 | Exceptional 6.9% |
| Maltese | 99.7 /100 | #63 | Exceptional 6.9% |
| Tongans | 99.7 /100 | #64 | Exceptional 6.9% |
| Immigrants | Kuwait | 99.7 /100 | #65 | Exceptional 6.9% |
| Immigrants | Belgium | 99.6 /100 | #66 | Exceptional 6.9% |
| Immigrants | Netherlands | 99.5 /100 | #67 | Exceptional 7.0% |
| Paraguayans | 99.4 /100 | #68 | Exceptional 7.0% |
| Immigrants | Eritrea | 99.4 /100 | #69 | Exceptional 7.0% |
| Immigrants | Iraq | 99.4 /100 | #70 | Exceptional 7.0% |
| Afghans | 99.4 /100 | #71 | Exceptional 7.0% |
| Cubans | 99.4 /100 | #72 | Exceptional 7.0% |
Demographics Similar to Immigrants from Spain by Unemployment Among Women with Children Under 6 years
In terms of unemployment among women with children under 6 years, the demographic groups most similar to Immigrants from Spain are Immigrants from Denmark (7.1%, a difference of 0.050%), Danish (7.1%, a difference of 0.060%), Immigrants from Hungary (7.1%, a difference of 0.090%), Albanian (7.2%, a difference of 0.20%), and Alsatian (7.1%, a difference of 0.22%).
| Demographics | Rating | Rank | Unemployment Among Women with Children Under 6 years |
| Egyptians | 98.7 /100 | #83 | Exceptional 7.1% |
| Immigrants | Albania | 98.7 /100 | #84 | Exceptional 7.1% |
| Immigrants | Romania | 98.7 /100 | #85 | Exceptional 7.1% |
| Immigrants | Zimbabwe | 98.6 /100 | #86 | Exceptional 7.1% |
| Alsatians | 98.4 /100 | #87 | Exceptional 7.1% |
| Immigrants | Hungary | 98.3 /100 | #88 | Exceptional 7.1% |
| Immigrants | Denmark | 98.3 /100 | #89 | Exceptional 7.1% |
| Immigrants | Spain | 98.2 /100 | #90 | Exceptional 7.1% |
| Danes | 98.2 /100 | #91 | Exceptional 7.1% |
| Albanians | 98.0 /100 | #92 | Exceptional 7.2% |
| New Zealanders | 97.8 /100 | #93 | Exceptional 7.2% |
| Macedonians | 97.7 /100 | #94 | Exceptional 7.2% |
| Romanians | 97.7 /100 | #95 | Exceptional 7.2% |
| Immigrants | Eastern Africa | 97.7 /100 | #96 | Exceptional 7.2% |
| Immigrants | South Eastern Asia | 97.6 /100 | #97 | Exceptional 7.2% |