Immigrants from Kuwait vs Peruvian Unemployment Among Women with Children Under 6 years
COMPARE
Immigrants from Kuwait
Peruvian
Unemployment Among Women with Children Under 6 years
Unemployment Among Women with Children Under 6 years Comparison
Immigrants from Kuwait
Peruvians
6.9%
UNEMPLOYMENT AMONG WOMEN WITH CHILDREN UNDER 6 YEARS
99.7/ 100
METRIC RATING
65th/ 347
METRIC RANK
7.5%
UNEMPLOYMENT AMONG WOMEN WITH CHILDREN UNDER 6 YEARS
72.3/ 100
METRIC RATING
157th/ 347
METRIC RANK
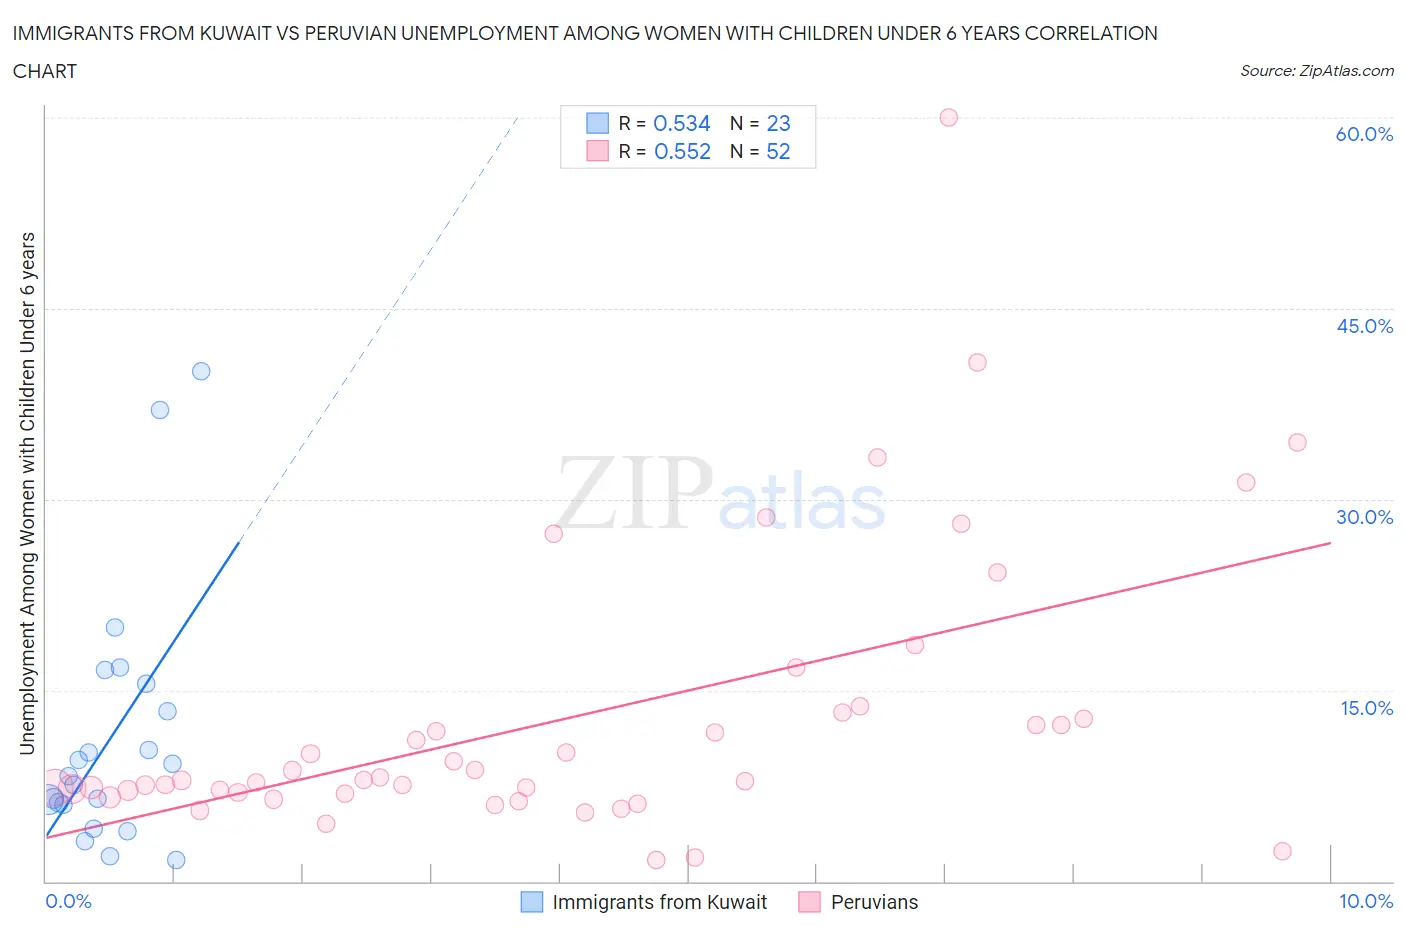
Immigrants from Kuwait vs Peruvian Unemployment Among Women with Children Under 6 years Correlation Chart
The statistical analysis conducted on geographies consisting of 121,724,889 people shows a substantial positive correlation between the proportion of Immigrants from Kuwait and unemployment rate among women with children under the age of 6 in the United States with a correlation coefficient (R) of 0.534 and weighted average of 6.9%. Similarly, the statistical analysis conducted on geographies consisting of 286,643,171 people shows a substantial positive correlation between the proportion of Peruvians and unemployment rate among women with children under the age of 6 in the United States with a correlation coefficient (R) of 0.552 and weighted average of 7.5%, a difference of 8.6%.
Unemployment Among Women with Children Under 6 years Correlation Summary
| Measurement | Immigrants from Kuwait | Peruvian |
| Minimum | 1.7% | 1.7% |
| Maximum | 40.1% | 60.0% |
| Range | 38.4% | 58.3% |
| Mean | 11.3% | 12.8% |
| Median | 8.2% | 7.9% |
| Interquartile 25% (IQ1) | 6.0% | 6.9% |
| Interquartile 75% (IQ3) | 15.5% | 13.1% |
| Interquartile Range (IQR) | 9.5% | 6.1% |
| Standard Deviation (Sample) | 9.9% | 11.2% |
| Standard Deviation (Population) | 9.7% | 11.1% |
Similar Demographics by Unemployment Among Women with Children Under 6 years
Demographics Similar to Immigrants from Kuwait by Unemployment Among Women with Children Under 6 years
In terms of unemployment among women with children under 6 years, the demographic groups most similar to Immigrants from Kuwait are Tongan (6.9%, a difference of 0.15%), Immigrants from Belgium (6.9%, a difference of 0.22%), Maltese (6.9%, a difference of 0.25%), Somali (6.9%, a difference of 0.29%), and Immigrants from France (6.9%, a difference of 0.33%).
| Demographics | Rating | Rank | Unemployment Among Women with Children Under 6 years |
| Immigrants | Turkey | 99.8 /100 | #58 | Exceptional 6.9% |
| Immigrants | Serbia | 99.8 /100 | #59 | Exceptional 6.9% |
| Immigrants | Sri Lanka | 99.8 /100 | #60 | Exceptional 6.9% |
| Immigrants | France | 99.7 /100 | #61 | Exceptional 6.9% |
| Somalis | 99.7 /100 | #62 | Exceptional 6.9% |
| Maltese | 99.7 /100 | #63 | Exceptional 6.9% |
| Tongans | 99.7 /100 | #64 | Exceptional 6.9% |
| Immigrants | Kuwait | 99.7 /100 | #65 | Exceptional 6.9% |
| Immigrants | Belgium | 99.6 /100 | #66 | Exceptional 6.9% |
| Immigrants | Netherlands | 99.5 /100 | #67 | Exceptional 7.0% |
| Paraguayans | 99.4 /100 | #68 | Exceptional 7.0% |
| Immigrants | Eritrea | 99.4 /100 | #69 | Exceptional 7.0% |
| Immigrants | Iraq | 99.4 /100 | #70 | Exceptional 7.0% |
| Afghans | 99.4 /100 | #71 | Exceptional 7.0% |
| Cubans | 99.4 /100 | #72 | Exceptional 7.0% |
Demographics Similar to Peruvians by Unemployment Among Women with Children Under 6 years
In terms of unemployment among women with children under 6 years, the demographic groups most similar to Peruvians are Croatian (7.5%, a difference of 0.030%), Immigrants from Southern Europe (7.5%, a difference of 0.080%), Immigrants from Philippines (7.5%, a difference of 0.080%), Bolivian (7.5%, a difference of 0.12%), and South American (7.5%, a difference of 0.16%).
| Demographics | Rating | Rank | Unemployment Among Women with Children Under 6 years |
| Aleuts | 76.0 /100 | #150 | Good 7.5% |
| Immigrants | Peru | 74.9 /100 | #151 | Good 7.5% |
| Bangladeshis | 74.8 /100 | #152 | Good 7.5% |
| Uruguayans | 74.7 /100 | #153 | Good 7.5% |
| Northern Europeans | 74.3 /100 | #154 | Good 7.5% |
| South Americans | 74.1 /100 | #155 | Good 7.5% |
| Immigrants | Southern Europe | 73.2 /100 | #156 | Good 7.5% |
| Peruvians | 72.3 /100 | #157 | Good 7.5% |
| Croatians | 71.9 /100 | #158 | Good 7.5% |
| Immigrants | Philippines | 71.3 /100 | #159 | Good 7.5% |
| Bolivians | 70.8 /100 | #160 | Good 7.5% |
| Immigrants | Western Asia | 70.2 /100 | #161 | Good 7.5% |
| Immigrants | Lithuania | 68.8 /100 | #162 | Good 7.5% |
| British | 66.3 /100 | #163 | Good 7.6% |
| Ugandans | 65.8 /100 | #164 | Good 7.6% |