Immigrants from Kuwait vs Immigrants from Spain Disability
COMPARE
Immigrants from Kuwait
Immigrants from Spain
Disability
Disability Comparison
Immigrants from Kuwait
Immigrants from Spain
10.7%
DISABILITY
100.0/ 100
METRIC RATING
33rd/ 347
METRIC RANK
10.9%
DISABILITY
99.8/ 100
METRIC RATING
53rd/ 347
METRIC RANK
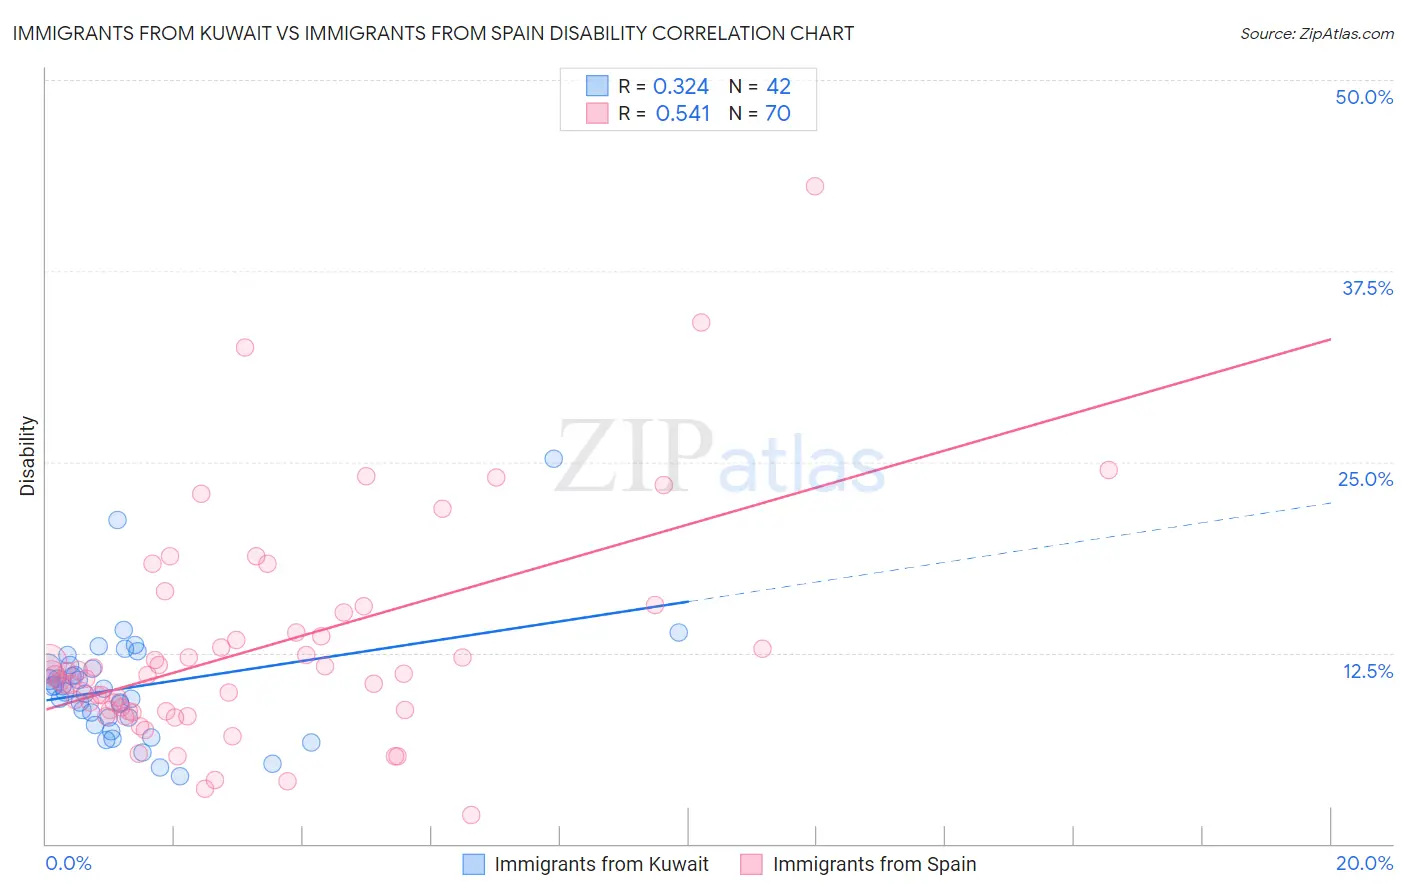
Immigrants from Kuwait vs Immigrants from Spain Disability Correlation Chart
The statistical analysis conducted on geographies consisting of 136,916,630 people shows a mild positive correlation between the proportion of Immigrants from Kuwait and percentage of population with a disability in the United States with a correlation coefficient (R) of 0.324 and weighted average of 10.7%. Similarly, the statistical analysis conducted on geographies consisting of 239,685,180 people shows a substantial positive correlation between the proportion of Immigrants from Spain and percentage of population with a disability in the United States with a correlation coefficient (R) of 0.541 and weighted average of 10.9%, a difference of 1.8%.
Disability Correlation Summary
| Measurement | Immigrants from Kuwait | Immigrants from Spain |
| Minimum | 4.4% | 1.9% |
| Maximum | 25.2% | 43.1% |
| Range | 20.8% | 41.2% |
| Mean | 10.3% | 12.7% |
| Median | 10.0% | 11.0% |
| Interquartile 25% (IQ1) | 8.3% | 8.7% |
| Interquartile 75% (IQ3) | 11.5% | 13.8% |
| Interquartile Range (IQR) | 3.2% | 5.1% |
| Standard Deviation (Sample) | 3.8% | 7.2% |
| Standard Deviation (Population) | 3.8% | 7.1% |
Demographics Similar to Immigrants from Kuwait and Immigrants from Spain by Disability
In terms of disability, the demographic groups most similar to Immigrants from Kuwait are Immigrants from Ethiopia (10.7%, a difference of 0.22%), Immigrants from Indonesia (10.7%, a difference of 0.23%), Ethiopian (10.7%, a difference of 0.29%), Turkish (10.7%, a difference of 0.30%), and Afghan (10.8%, a difference of 0.74%). Similarly, the demographic groups most similar to Immigrants from Spain are South American (10.9%, a difference of 0.020%), Peruvian (10.9%, a difference of 0.080%), Vietnamese (10.9%, a difference of 0.090%), Immigrants from Saudi Arabia (10.9%, a difference of 0.090%), and Soviet Union (10.9%, a difference of 0.15%).
| Demographics | Rating | Rank | Disability |
| Immigrants | Kuwait | 100.0 /100 | #33 | Exceptional 10.7% |
| Immigrants | Ethiopia | 100.0 /100 | #34 | Exceptional 10.7% |
| Immigrants | Indonesia | 100.0 /100 | #35 | Exceptional 10.7% |
| Ethiopians | 100.0 /100 | #36 | Exceptional 10.7% |
| Turks | 100.0 /100 | #37 | Exceptional 10.7% |
| Afghans | 99.9 /100 | #38 | Exceptional 10.8% |
| Cambodians | 99.9 /100 | #39 | Exceptional 10.8% |
| Mongolians | 99.9 /100 | #40 | Exceptional 10.8% |
| Immigrants | Australia | 99.9 /100 | #41 | Exceptional 10.8% |
| Immigrants | Nepal | 99.9 /100 | #42 | Exceptional 10.8% |
| Israelis | 99.9 /100 | #43 | Exceptional 10.8% |
| Immigrants | Japan | 99.9 /100 | #44 | Exceptional 10.8% |
| Immigrants | Peru | 99.9 /100 | #45 | Exceptional 10.8% |
| Tongans | 99.9 /100 | #46 | Exceptional 10.8% |
| Taiwanese | 99.9 /100 | #47 | Exceptional 10.8% |
| Soviet Union | 99.9 /100 | #48 | Exceptional 10.9% |
| Vietnamese | 99.9 /100 | #49 | Exceptional 10.9% |
| Immigrants | Saudi Arabia | 99.9 /100 | #50 | Exceptional 10.9% |
| Peruvians | 99.8 /100 | #51 | Exceptional 10.9% |
| South Americans | 99.8 /100 | #52 | Exceptional 10.9% |
| Immigrants | Spain | 99.8 /100 | #53 | Exceptional 10.9% |