Immigrants from Kazakhstan vs Immigrants from Micronesia Unemployment Among Women with Children Ages 6 to 17 years
COMPARE
Immigrants from Kazakhstan
Immigrants from Micronesia
Unemployment Among Women with Children Ages 6 to 17 years
Unemployment Among Women with Children Ages 6 to 17 years Comparison
Immigrants from Kazakhstan
Immigrants from Micronesia
9.1%
UNEMPLOYMENT AMONG WOMEN WITH CHILDREN AGES 6 TO 17 YEARS
25.3/ 100
METRIC RATING
194th/ 347
METRIC RANK
8.9%
UNEMPLOYMENT AMONG WOMEN WITH CHILDREN AGES 6 TO 17 YEARS
59.2/ 100
METRIC RATING
165th/ 347
METRIC RANK
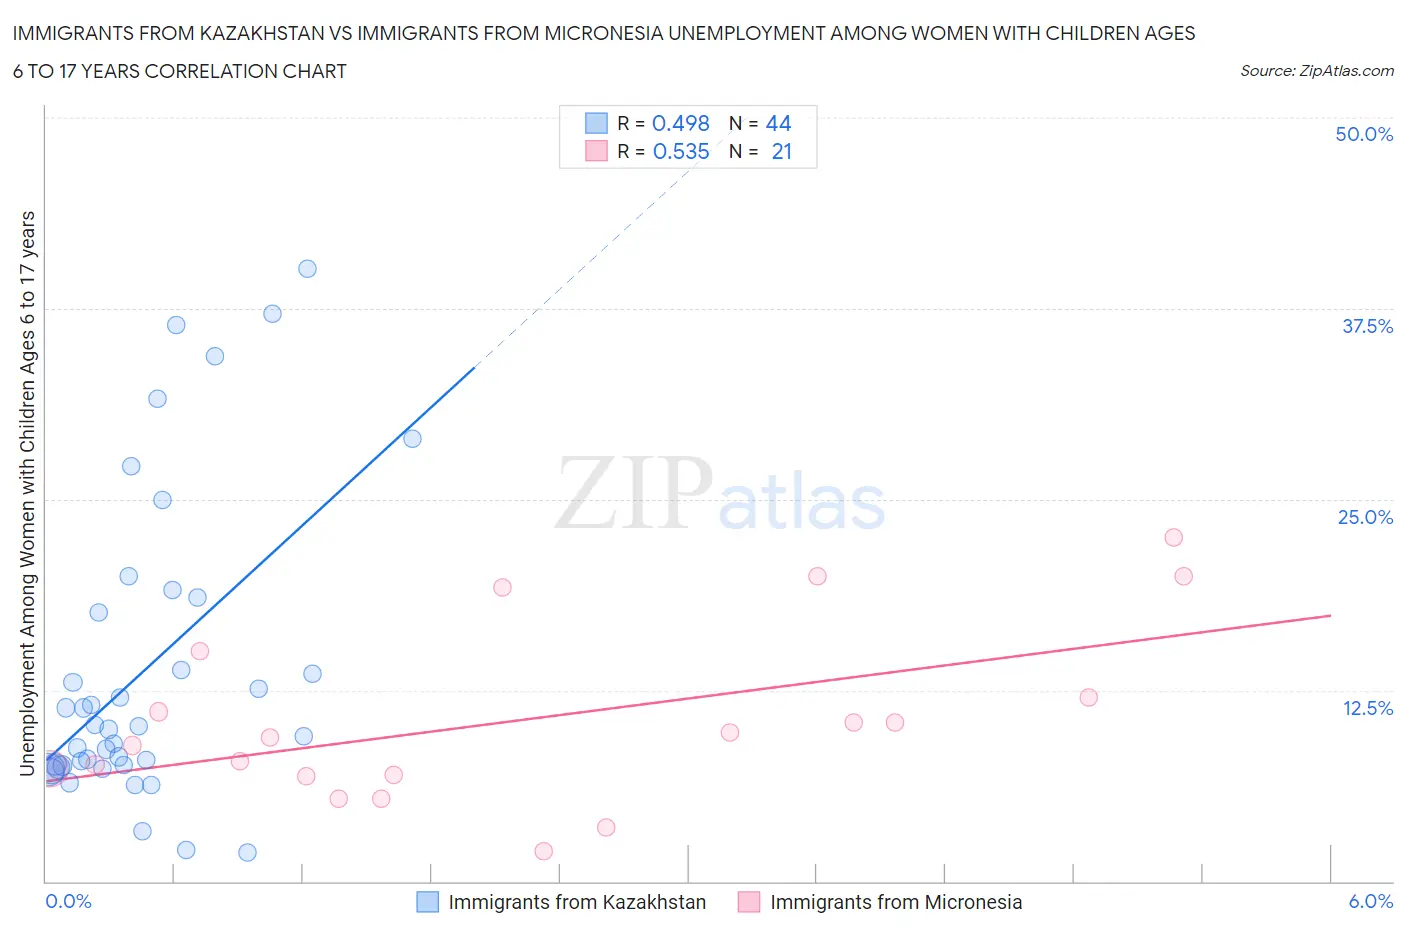
Immigrants from Kazakhstan vs Immigrants from Micronesia Unemployment Among Women with Children Ages 6 to 17 years Correlation Chart
The statistical analysis conducted on geographies consisting of 103,492,254 people shows a moderate positive correlation between the proportion of Immigrants from Kazakhstan and unemployment rate among women with children between the ages 6 and 17 in the United States with a correlation coefficient (R) of 0.498 and weighted average of 9.1%. Similarly, the statistical analysis conducted on geographies consisting of 55,240,851 people shows a substantial positive correlation between the proportion of Immigrants from Micronesia and unemployment rate among women with children between the ages 6 and 17 in the United States with a correlation coefficient (R) of 0.535 and weighted average of 8.9%, a difference of 1.6%.
Unemployment Among Women with Children Ages 6 to 17 years Correlation Summary
| Measurement | Immigrants from Kazakhstan | Immigrants from Micronesia |
| Minimum | 1.9% | 2.0% |
| Maximum | 40.1% | 22.5% |
| Range | 38.2% | 20.5% |
| Mean | 13.9% | 10.6% |
| Median | 10.0% | 9.4% |
| Interquartile 25% (IQ1) | 7.6% | 6.9% |
| Interquartile 75% (IQ3) | 18.1% | 13.5% |
| Interquartile Range (IQR) | 10.5% | 6.7% |
| Standard Deviation (Sample) | 10.0% | 5.7% |
| Standard Deviation (Population) | 9.8% | 5.6% |
Similar Demographics by Unemployment Among Women with Children Ages 6 to 17 years
Demographics Similar to Immigrants from Kazakhstan by Unemployment Among Women with Children Ages 6 to 17 years
In terms of unemployment among women with children ages 6 to 17 years, the demographic groups most similar to Immigrants from Kazakhstan are Austrian (9.1%, a difference of 0.020%), Immigrants from Turkey (9.1%, a difference of 0.030%), Brazilian (9.1%, a difference of 0.050%), Immigrants from Panama (9.1%, a difference of 0.060%), and Guamanian/Chamorro (9.1%, a difference of 0.11%).
| Demographics | Rating | Rank | Unemployment Among Women with Children Ages 6 to 17 years |
| Comanche | 30.0 /100 | #187 | Fair 9.0% |
| Immigrants | Syria | 29.7 /100 | #188 | Fair 9.1% |
| Immigrants | Immigrants | 29.2 /100 | #189 | Fair 9.1% |
| Slovenes | 28.5 /100 | #190 | Fair 9.1% |
| Belizeans | 28.4 /100 | #191 | Fair 9.1% |
| Guamanians/Chamorros | 27.2 /100 | #192 | Fair 9.1% |
| Immigrants | Turkey | 25.8 /100 | #193 | Fair 9.1% |
| Immigrants | Kazakhstan | 25.3 /100 | #194 | Fair 9.1% |
| Austrians | 25.0 /100 | #195 | Fair 9.1% |
| Brazilians | 24.4 /100 | #196 | Fair 9.1% |
| Immigrants | Panama | 24.3 /100 | #197 | Fair 9.1% |
| Guyanese | 21.8 /100 | #198 | Fair 9.1% |
| Czechoslovakians | 20.8 /100 | #199 | Fair 9.1% |
| Trinidadians and Tobagonians | 18.2 /100 | #200 | Poor 9.1% |
| Immigrants | Trinidad and Tobago | 16.7 /100 | #201 | Poor 9.1% |
Demographics Similar to Immigrants from Micronesia by Unemployment Among Women with Children Ages 6 to 17 years
In terms of unemployment among women with children ages 6 to 17 years, the demographic groups most similar to Immigrants from Micronesia are Ukrainian (8.9%, a difference of 0.020%), Moroccan (8.9%, a difference of 0.040%), Mexican American Indian (8.9%, a difference of 0.060%), Immigrants from Netherlands (8.9%, a difference of 0.070%), and Immigrants from England (8.9%, a difference of 0.070%).
| Demographics | Rating | Rank | Unemployment Among Women with Children Ages 6 to 17 years |
| Immigrants | Chile | 65.3 /100 | #158 | Good 8.9% |
| Spanish | 63.8 /100 | #159 | Good 8.9% |
| Immigrants | Hungary | 63.4 /100 | #160 | Good 8.9% |
| Immigrants | Guyana | 63.0 /100 | #161 | Good 8.9% |
| Immigrants | Netherlands | 60.8 /100 | #162 | Good 8.9% |
| Mexican American Indians | 60.6 /100 | #163 | Good 8.9% |
| Ukrainians | 59.7 /100 | #164 | Average 8.9% |
| Immigrants | Micronesia | 59.2 /100 | #165 | Average 8.9% |
| Moroccans | 58.3 /100 | #166 | Average 8.9% |
| Immigrants | England | 57.7 /100 | #167 | Average 8.9% |
| Immigrants | Croatia | 57.1 /100 | #168 | Average 8.9% |
| British | 55.2 /100 | #169 | Average 8.9% |
| Turks | 54.1 /100 | #170 | Average 8.9% |
| Jordanians | 52.2 /100 | #171 | Average 9.0% |
| Immigrants | West Indies | 52.2 /100 | #172 | Average 9.0% |