French Canadian vs Immigrants from Micronesia Unemployment Among Women with Children Ages 6 to 17 years
COMPARE
French Canadian
Immigrants from Micronesia
Unemployment Among Women with Children Ages 6 to 17 years
Unemployment Among Women with Children Ages 6 to 17 years Comparison
French Canadians
Immigrants from Micronesia
10.3%
UNEMPLOYMENT AMONG WOMEN WITH CHILDREN AGES 6 TO 17 YEARS
0.0/ 100
METRIC RATING
309th/ 347
METRIC RANK
8.9%
UNEMPLOYMENT AMONG WOMEN WITH CHILDREN AGES 6 TO 17 YEARS
59.2/ 100
METRIC RATING
165th/ 347
METRIC RANK
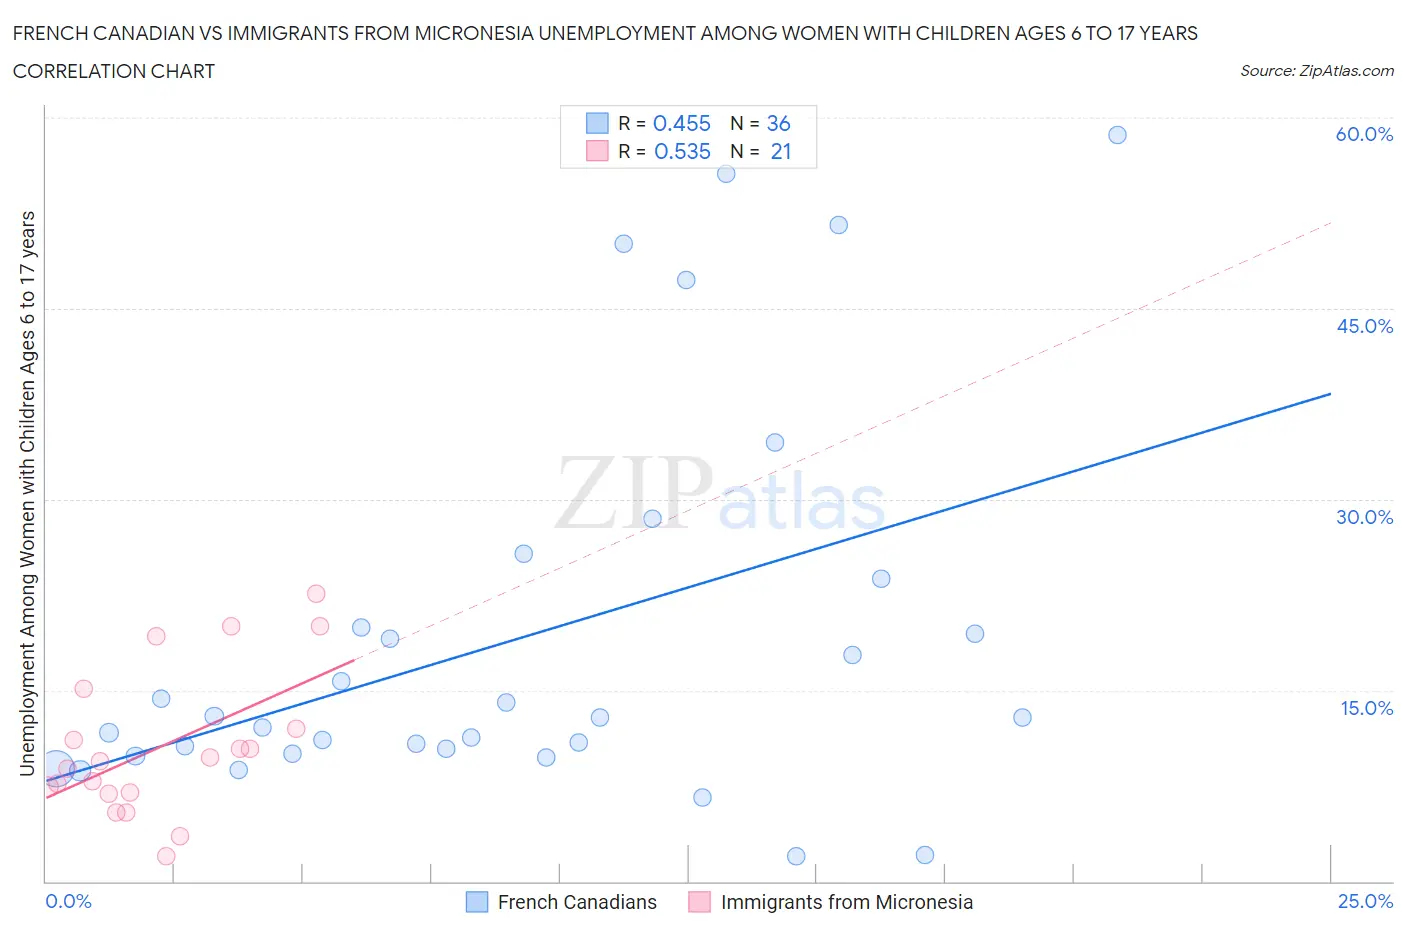
French Canadian vs Immigrants from Micronesia Unemployment Among Women with Children Ages 6 to 17 years Correlation Chart
The statistical analysis conducted on geographies consisting of 329,058,978 people shows a moderate positive correlation between the proportion of French Canadians and unemployment rate among women with children between the ages 6 and 17 in the United States with a correlation coefficient (R) of 0.455 and weighted average of 10.3%. Similarly, the statistical analysis conducted on geographies consisting of 55,240,851 people shows a substantial positive correlation between the proportion of Immigrants from Micronesia and unemployment rate among women with children between the ages 6 and 17 in the United States with a correlation coefficient (R) of 0.535 and weighted average of 8.9%, a difference of 15.4%.
Unemployment Among Women with Children Ages 6 to 17 years Correlation Summary
| Measurement | French Canadian | Immigrants from Micronesia |
| Minimum | 2.0% | 2.0% |
| Maximum | 58.6% | 22.5% |
| Range | 56.6% | 20.5% |
| Mean | 19.2% | 10.6% |
| Median | 12.9% | 9.4% |
| Interquartile 25% (IQ1) | 10.2% | 6.9% |
| Interquartile 75% (IQ3) | 21.8% | 13.5% |
| Interquartile Range (IQR) | 11.6% | 6.7% |
| Standard Deviation (Sample) | 15.2% | 5.7% |
| Standard Deviation (Population) | 15.0% | 5.6% |
Similar Demographics by Unemployment Among Women with Children Ages 6 to 17 years
Demographics Similar to French Canadians by Unemployment Among Women with Children Ages 6 to 17 years
In terms of unemployment among women with children ages 6 to 17 years, the demographic groups most similar to French Canadians are Alaska Native (10.3%, a difference of 0.050%), Immigrants from Liberia (10.3%, a difference of 0.080%), Dutch West Indian (10.2%, a difference of 0.54%), Immigrants from Senegal (10.2%, a difference of 0.55%), and Paraguayan (10.2%, a difference of 0.78%).
| Demographics | Rating | Rank | Unemployment Among Women with Children Ages 6 to 17 years |
| Venezuelans | 0.0 /100 | #302 | Tragic 10.2% |
| Immigrants | Ecuador | 0.0 /100 | #303 | Tragic 10.2% |
| Immigrants | Venezuela | 0.0 /100 | #304 | Tragic 10.2% |
| Immigrants | Nigeria | 0.0 /100 | #305 | Tragic 10.2% |
| Paraguayans | 0.0 /100 | #306 | Tragic 10.2% |
| Immigrants | Senegal | 0.0 /100 | #307 | Tragic 10.2% |
| Dutch West Indians | 0.0 /100 | #308 | Tragic 10.2% |
| French Canadians | 0.0 /100 | #309 | Tragic 10.3% |
| Alaska Natives | 0.0 /100 | #310 | Tragic 10.3% |
| Immigrants | Liberia | 0.0 /100 | #311 | Tragic 10.3% |
| Africans | 0.0 /100 | #312 | Tragic 10.4% |
| Americans | 0.0 /100 | #313 | Tragic 10.4% |
| Immigrants | Cabo Verde | 0.0 /100 | #314 | Tragic 10.4% |
| Bahamians | 0.0 /100 | #315 | Tragic 10.4% |
| Immigrants | Dominica | 0.0 /100 | #316 | Tragic 10.5% |
Demographics Similar to Immigrants from Micronesia by Unemployment Among Women with Children Ages 6 to 17 years
In terms of unemployment among women with children ages 6 to 17 years, the demographic groups most similar to Immigrants from Micronesia are Ukrainian (8.9%, a difference of 0.020%), Moroccan (8.9%, a difference of 0.040%), Mexican American Indian (8.9%, a difference of 0.060%), Immigrants from Netherlands (8.9%, a difference of 0.070%), and Immigrants from England (8.9%, a difference of 0.070%).
| Demographics | Rating | Rank | Unemployment Among Women with Children Ages 6 to 17 years |
| Immigrants | Chile | 65.3 /100 | #158 | Good 8.9% |
| Spanish | 63.8 /100 | #159 | Good 8.9% |
| Immigrants | Hungary | 63.4 /100 | #160 | Good 8.9% |
| Immigrants | Guyana | 63.0 /100 | #161 | Good 8.9% |
| Immigrants | Netherlands | 60.8 /100 | #162 | Good 8.9% |
| Mexican American Indians | 60.6 /100 | #163 | Good 8.9% |
| Ukrainians | 59.7 /100 | #164 | Average 8.9% |
| Immigrants | Micronesia | 59.2 /100 | #165 | Average 8.9% |
| Moroccans | 58.3 /100 | #166 | Average 8.9% |
| Immigrants | England | 57.7 /100 | #167 | Average 8.9% |
| Immigrants | Croatia | 57.1 /100 | #168 | Average 8.9% |
| British | 55.2 /100 | #169 | Average 8.9% |
| Turks | 54.1 /100 | #170 | Average 8.9% |
| Jordanians | 52.2 /100 | #171 | Average 9.0% |
| Immigrants | West Indies | 52.2 /100 | #172 | Average 9.0% |