Immigrants from Jordan vs Navajo Unemployment Among Ages 60 to 64 years

COMPARE

Immigrants from Jordan
Race
Ancestry
AfghanAfricanAlaska NativeAlaskan AthabascanAlbanianAleutAlsatianAmericanApacheArabArapahoArgentineanArmenianAssyrian/Chaldean/SyriacAustralianAustrianBahamianBangladeshiBarbadianBasqueBelgianBelizeanBermudanBhutaneseBlackfeetBolivianBrazilianBritishBritish West IndianBulgarianBurmeseCajunCambodianCanadianCape VerdeanCarpatho RusynCelticCentral AmericanCentral American IndianCherokeeCheyenneChickasawChileanChineseChippewaChoctawColombianColvilleComancheCosta RicanCreeCreekCroatianCrowCubanCypriotCzechCzechoslovakianDanishDelawareDominicanDutchDutch West IndianEastern EuropeanEcuadorianEgyptianEnglishEstonianEthiopianEuropeanFijianFilipinoFinnishFrenchFrench American IndianFrench CanadianGermanGerman RussianGhanaianGreekGuamanian/ChamorroGuatemalanGuyaneseHaitianHmongHonduranHopiHoumaHungarianIcelanderIndian (Asian)IndonesianInupiatIranianIraqiIrishIroquoisIsraeliItalianJamaicanJapaneseJordanianKenyanKiowaKoreanLaotianLatvianLebaneseLiberianLithuanianLumbeeLuxembourgerMacedonianMalaysianMalteseMarshalleseMenomineeMexicanMexican American IndianMongolianMoroccanNative HawaiianNepaleseNew ZealanderNicaraguanNigerianNorthern EuropeanNorwegianOkinawanOsageOttawaPaiutePakistaniPalestinianPanamanianParaguayanPennsylvania GermanPeruvianPimaPolishPortuguesePotawatomiPuebloPuerto RicanPuget Sound SalishRomanianRussianSalvadoranSamoanScandinavianScotch-IrishScottishSeminoleSenegaleseSerbianShoshoneSierra LeoneanSiouxSlavicSlovakSloveneSomaliSouth AfricanSouth AmericanSouth American IndianSoviet UnionSpaniardSpanishSpanish AmericanSpanish American IndianSri LankanSubsaharan AfricanSudaneseSwedishSwissSyrianTaiwaneseThaiTlingit-HaidaTohono O'OdhamTonganTrinidadian and TobagonianTsimshianTurkishU.S. Virgin IslanderUgandanUkrainianUruguayanUteVenezuelanVietnameseWelshWest IndianYakamaYaquiYugoslavianYumanYup'ikZimbabwean
Immigration
NonimmigrantsImmigrantsAfghanistanAfricaAlbaniaArgentinaArmeniaAsiaAustraliaAustriaBahamasBangladeshBarbadosBelarusBelgiumBelizeBoliviaBosnia and HerzegovinaBrazilBulgariaBurma/MyanmarCabo VerdeCambodiaCameroonCanadaCaribbeanCentral AmericaChileChinaColombiaCongoCosta RicaCroatiaCubaCzechoslovakiaDenmarkDominicaDominican RepublicEastern AfricaEastern AsiaEastern EuropeEcuadorEgyptEl SalvadorEnglandEritreaEthiopiaEuropeFijiFranceGermanyGhanaGreeceGrenadaGuatemalaGuyanaHaitiHondurasHong KongHungaryIndiaIndonesiaIranIraqIrelandIsraelItalyJamaicaJapanJordanKazakhstanKenyaKoreaKuwaitLaosLatin AmericaLatviaLebanonLiberiaLithuaniaMalaysiaMexicoMicronesiaMiddle AfricaMoldovaMoroccoNepalNetherlandsNicaraguaNigeriaNorth AmericaNorth MacedoniaNorthern AfricaNorthern EuropeNorwayOceaniaPakistanPanamaPeruPhilippinesPolandPortugalRomaniaRussiaSaudi ArabiaScotlandSenegalSerbiaSierra LeoneSingaporeSomaliaSouth AfricaSouth AmericaSouth Central AsiaSouth Eastern AsiaSouthern EuropeSpainSri LankaSt. Vincent and the GrenadinesSudanSwedenSwitzerlandSyriaTaiwanThailandTrinidad and TobagoTurkeyUgandaUkraineUruguayUzbekistanVenezuelaVietnamWest IndiesWestern AfricaWestern AsiaWestern EuropeYemenZaireZimbabweAzores
Navajo
Race
Ancestry
AfghanAfricanAlaska NativeAlaskan AthabascanAlbanianAleutAlsatianAmericanApacheArabArapahoArgentineanArmenianAssyrian/Chaldean/SyriacAustralianAustrianBahamianBangladeshiBarbadianBasqueBelgianBelizeanBermudanBhutaneseBlackfeetBolivianBrazilianBritishBritish West IndianBulgarianBurmeseCajunCambodianCanadianCape VerdeanCarpatho RusynCelticCentral AmericanCentral American IndianCherokeeCheyenneChickasawChileanChineseChippewaChoctawColombianColvilleComancheCosta RicanCreeCreekCroatianCrowCubanCypriotCzechCzechoslovakianDanishDelawareDominicanDutchDutch West IndianEastern EuropeanEcuadorianEgyptianEnglishEstonianEthiopianEuropeanFijianFilipinoFinnishFrenchFrench American IndianFrench CanadianGermanGerman RussianGhanaianGreekGuamanian/ChamorroGuatemalanGuyaneseHaitianHmongHonduranHopiHoumaHungarianIcelanderIndian (Asian)IndonesianInupiatIranianIraqiIrishIroquoisIsraeliItalianJamaicanJapaneseJordanianKenyanKiowaKoreanLaotianLatvianLebaneseLiberianLithuanianLumbeeLuxembourgerMacedonianMalaysianMalteseMarshalleseMenomineeMexicanMexican American IndianMongolianMoroccanNative HawaiianNavajoNepaleseNew ZealanderNicaraguanNigerianNorthern EuropeanNorwegianOkinawanOsageOttawaPaiutePakistaniPalestinianPanamanianParaguayanPennsylvania GermanPeruvianPimaPolishPortuguesePotawatomiPuebloPuerto RicanPuget Sound SalishRomanianRussianSalvadoranSamoanScandinavianScotch-IrishScottishSeminoleSenegaleseSerbianShoshoneSierra LeoneanSiouxSlavicSlovakSloveneSomaliSouth AfricanSouth AmericanSouth American IndianSoviet UnionSpaniardSpanishSpanish AmericanSpanish American IndianSri LankanSubsaharan AfricanSudaneseSwedishSwissSyrianTaiwaneseThaiTlingit-HaidaTohono O'OdhamTonganTrinidadian and TobagonianTsimshianTurkishU.S. Virgin IslanderUgandanUkrainianUruguayanUteVenezuelanVietnameseWelshWest IndianYakamaYaquiYugoslavianYumanYup'ikZimbabwean
Immigration
NonimmigrantsImmigrantsAfghanistanAfricaAlbaniaArgentinaArmeniaAsiaAustraliaAustriaBahamasBangladeshBarbadosBelarusBelgiumBelizeBoliviaBosnia and HerzegovinaBrazilBulgariaBurma/MyanmarCabo VerdeCambodiaCameroonCanadaCaribbeanCentral AmericaChileChinaColombiaCongoCosta RicaCroatiaCubaCzechoslovakiaDenmarkDominicaDominican RepublicEastern AfricaEastern AsiaEastern EuropeEcuadorEgyptEl SalvadorEnglandEritreaEthiopiaEuropeFijiFranceGermanyGhanaGreeceGrenadaGuatemalaGuyanaHaitiHondurasHong KongHungaryIndiaIndonesiaIranIraqIrelandIsraelItalyJamaicaJapanKazakhstanKenyaKoreaKuwaitLaosLatin AmericaLatviaLebanonLiberiaLithuaniaMalaysiaMexicoMicronesiaMiddle AfricaMoldovaMoroccoNepalNetherlandsNicaraguaNigeriaNorth AmericaNorth MacedoniaNorthern AfricaNorthern EuropeNorwayOceaniaPakistanPanamaPeruPhilippinesPolandPortugalRomaniaRussiaSaudi ArabiaScotlandSenegalSerbiaSierra LeoneSingaporeSomaliaSouth AfricaSouth AmericaSouth Central AsiaSouth Eastern AsiaSouthern EuropeSpainSri LankaSt. Vincent and the GrenadinesSudanSwedenSwitzerlandSyriaTaiwanThailandTrinidad and TobagoTurkeyUgandaUkraineUruguayUzbekistanVenezuelaVietnamWest IndiesWestern AfricaWestern AsiaWestern EuropeYemenZaireZimbabweAzores
Unemployment Among Ages 60 to 64 years
Income
Poverty
Unemployment
Labor Participation
Family Structure
Vehicle Availability
Education Level
Disability

Unemployment Among Ages 60 to 64 years Comparison

Immigrants from Jordan

Navajo

Exceptional
Tragic
4.7%
UNEMPLOYMENT AMONG AGES 60 TO 64 YEARS
98.8/ 100
METRIC RATING
87th/ 347
METRIC RANK
6.3%
UNEMPLOYMENT AMONG AGES 60 TO 64 YEARS
0.0/ 100
METRIC RATING
337th/ 347
METRIC RANK

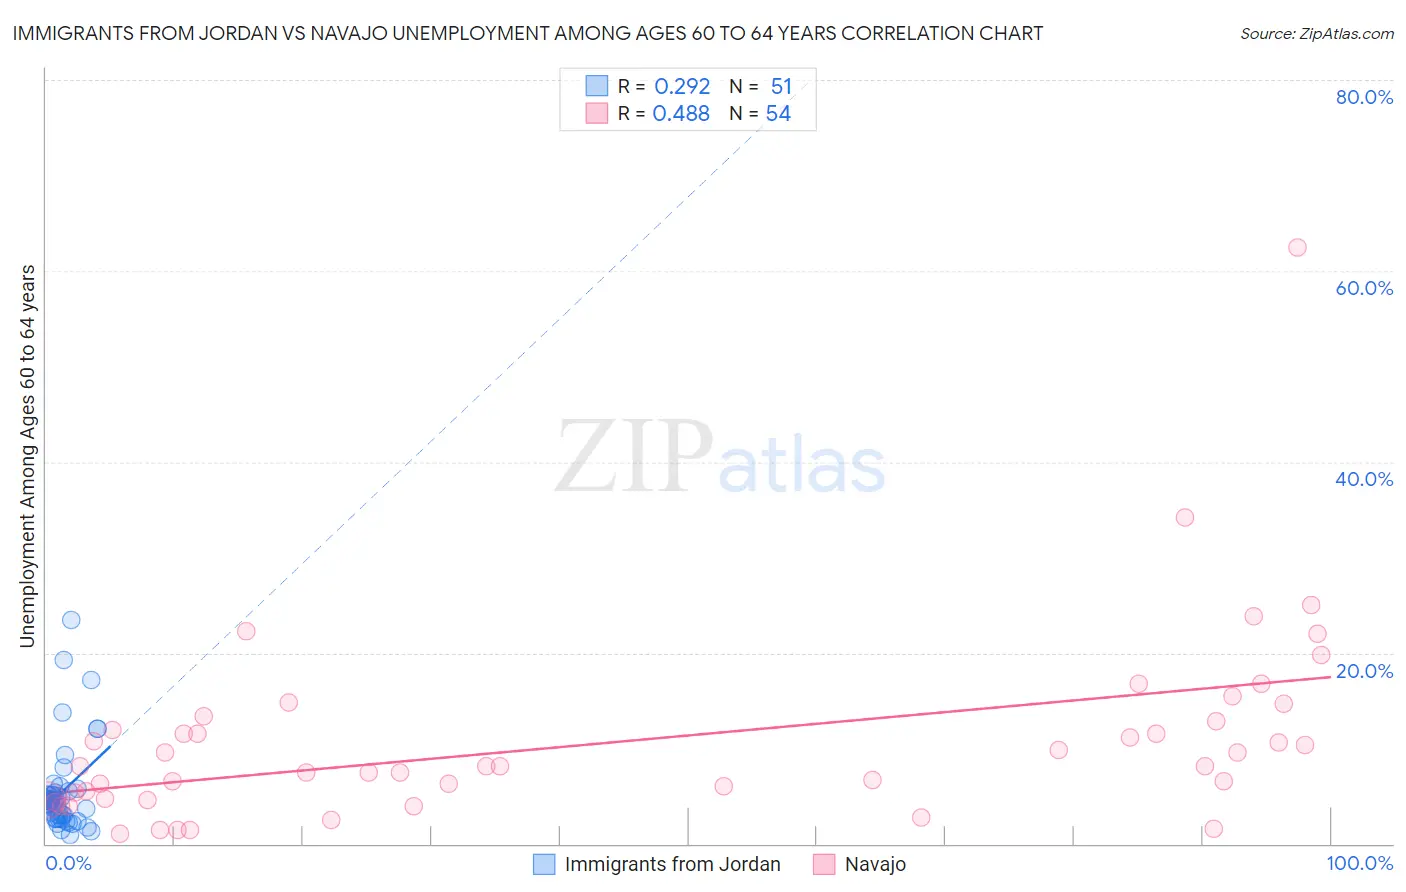
Immigrants from Jordan vs Navajo Unemployment Among Ages 60 to 64 years Correlation Chart

The statistical analysis conducted on geographies consisting of 173,766,097 people shows a weak positive correlation between the proportion of Immigrants from Jordan and unemployment rate among population between the ages 60 and 64 in the United States with a correlation coefficient (R) of 0.292 and weighted average of 4.7%. Similarly, the statistical analysis conducted on geographies consisting of 208,494,883 people shows a moderate positive correlation between the proportion of Navajo and unemployment rate among population between the ages 60 and 64 in the United States with a correlation coefficient (R) of 0.488 and weighted average of 6.3%, a difference of 34.3%.
Immigrants from Jordan vs Navajo Unemployment Among Ages 60 to 64 years

Unemployment Among Ages 60 to 64 years Correlation Summary

MeasurementImmigrants from JordanNavajo
Minimum0.90%1.0%
Maximum23.5%62.5%
Range22.6%61.5%
Mean5.4%10.7%
Median4.5%8.1%
Interquartile 25% (IQ1)2.7%4.8%
Interquartile 75% (IQ3)5.4%12.8%
Interquartile Range (IQR)2.7%8.0%
Standard Deviation (Sample)4.5%9.9%
Standard Deviation (Population)4.5%9.8%

Similar Demographics by Unemployment Among Ages 60 to 64 years

Demographics Similar to Immigrants from Jordan by Unemployment Among Ages 60 to 64 years

In terms of unemployment among ages 60 to 64 years, the demographic groups most similar to Immigrants from Jordan are Immigrants from Oceania (4.7%, a difference of 0.040%), Thai (4.7%, a difference of 0.060%), Immigrants from Sri Lanka (4.7%, a difference of 0.060%), Immigrants from Bulgaria (4.7%, a difference of 0.070%), and Immigrants from Northern Africa (4.7%, a difference of 0.070%).
DemographicsRating | RankUnemployment Among Ages 60 to 64 years
Icelanders
99.1
/100
|
#80
Exceptional
4.7%
Iroquois
99.1
/100
|
#81
Exceptional
4.7%
Okinawans
99.1
/100
|
#82
Exceptional
4.7%
Immigrants | Egypt
99.1
/100
|
#83
Exceptional
4.7%
Thais
98.9
/100
|
#84
Exceptional
4.7%
Immigrants | Sri Lanka
98.9
/100
|
#85
Exceptional
4.7%
Immigrants | Oceania
98.9
/100
|
#86
Exceptional
4.7%
Immigrants | Jordan
98.8
/100
|
#87
Exceptional
4.7%
Immigrants | Bulgaria
98.7
/100
|
#88
Exceptional
4.7%
Immigrants | Northern Africa
98.7
/100
|
#89
Exceptional
4.7%
Immigrants | Liberia
98.7
/100
|
#90
Exceptional
4.7%
Immigrants | Uganda
98.4
/100
|
#91
Exceptional
4.7%
Romanians
98.4
/100
|
#92
Exceptional
4.7%
Immigrants | Saudi Arabia
98.3
/100
|
#93
Exceptional
4.7%
Immigrants | Kuwait
98.3
/100
|
#94
Exceptional
4.7%

Demographics Similar to Navajo by Unemployment Among Ages 60 to 64 years

In terms of unemployment among ages 60 to 64 years, the demographic groups most similar to Navajo are Arapaho (6.3%, a difference of 0.48%), Kiowa (6.2%, a difference of 1.1%), Tlingit-Haida (6.4%, a difference of 1.9%), Vietnamese (6.1%, a difference of 3.0%), and Puerto Rican (6.1%, a difference of 3.3%).
DemographicsRating | RankUnemployment Among Ages 60 to 64 years
Immigrants | Armenia
0.0
/100
|
#330
Tragic
6.0%
Yakama
0.0
/100
|
#331
Tragic
6.0%
Dominicans
0.0
/100
|
#332
Tragic
6.0%
Immigrants | Dominican Republic
0.0
/100
|
#333
Tragic
6.0%
Puerto Ricans
0.0
/100
|
#334
Tragic
6.1%
Vietnamese
0.0
/100
|
#335
Tragic
6.1%
Kiowa
0.0
/100
|
#336
Tragic
6.2%
Navajo
0.0
/100
|
#337
Tragic
6.3%
Arapaho
0.0
/100
|
#338
Tragic
6.3%
Tlingit-Haida
0.0
/100
|
#339
Tragic
6.4%
Pueblo
0.0
/100
|
#340
Tragic
6.7%
Yuman
0.0
/100
|
#341
Tragic
6.8%
Aleuts
0.0
/100
|
#342
Tragic
6.8%
Immigrants | Yemen
0.0
/100
|
#343
Tragic
6.8%
Alaska Natives
0.0
/100
|
#344
Tragic
7.6%