Immigrants from Jordan vs Ecuadorian Unemployment Among Ages 60 to 64 years
COMPARE
Immigrants from Jordan
Ecuadorian
Unemployment Among Ages 60 to 64 years
Unemployment Among Ages 60 to 64 years Comparison
Immigrants from Jordan
Ecuadorians
4.7%
UNEMPLOYMENT AMONG AGES 60 TO 64 YEARS
98.8/ 100
METRIC RATING
87th/ 347
METRIC RANK
5.8%
UNEMPLOYMENT AMONG AGES 60 TO 64 YEARS
0.0/ 100
METRIC RATING
322nd/ 347
METRIC RANK
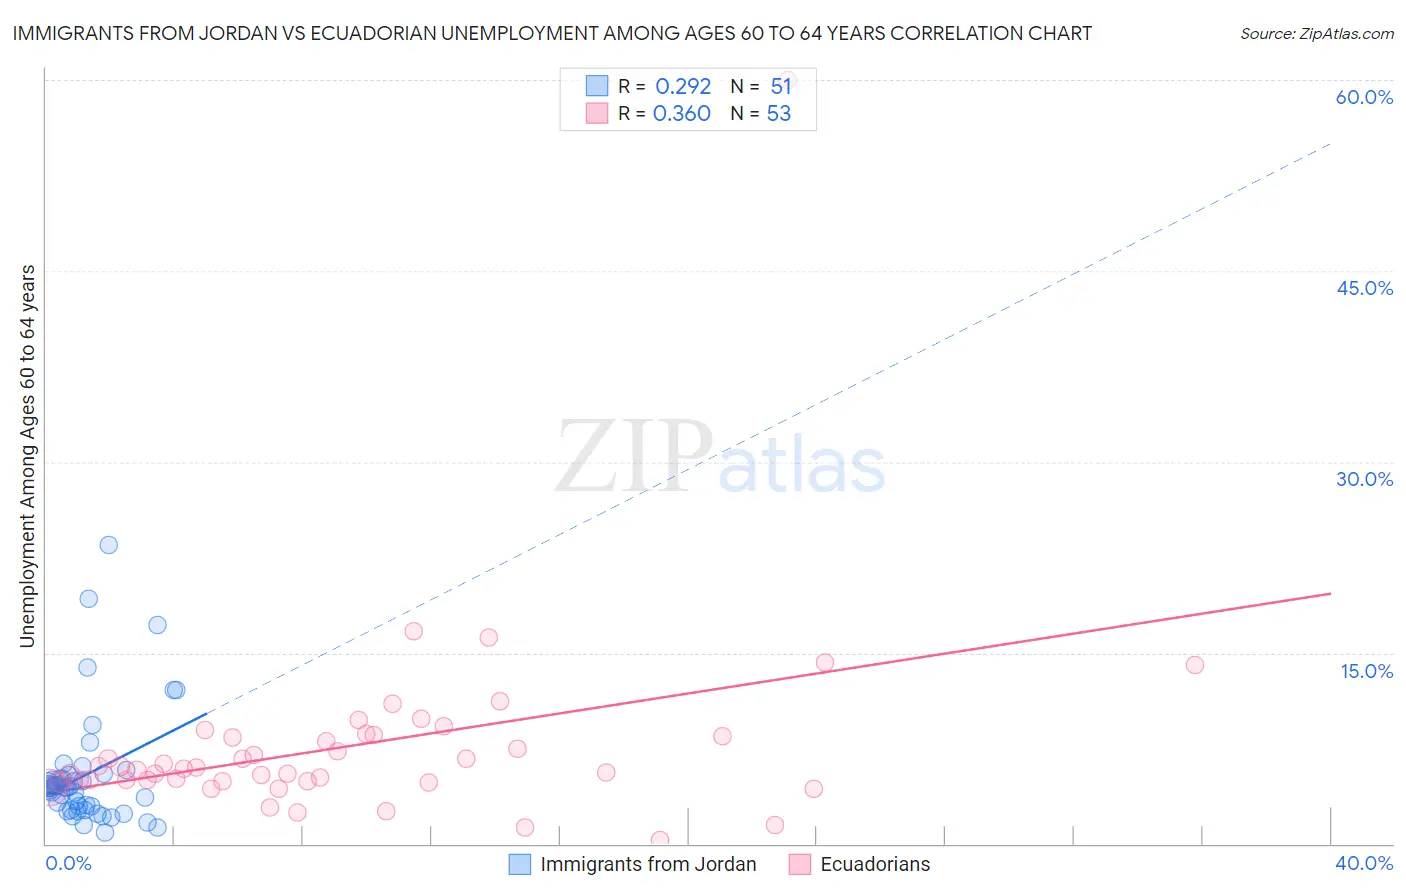
Immigrants from Jordan vs Ecuadorian Unemployment Among Ages 60 to 64 years Correlation Chart
The statistical analysis conducted on geographies consisting of 173,766,097 people shows a weak positive correlation between the proportion of Immigrants from Jordan and unemployment rate among population between the ages 60 and 64 in the United States with a correlation coefficient (R) of 0.292 and weighted average of 4.7%. Similarly, the statistical analysis conducted on geographies consisting of 296,354,650 people shows a mild positive correlation between the proportion of Ecuadorians and unemployment rate among population between the ages 60 and 64 in the United States with a correlation coefficient (R) of 0.360 and weighted average of 5.8%, a difference of 23.3%.
Unemployment Among Ages 60 to 64 years Correlation Summary
| Measurement | Immigrants from Jordan | Ecuadorian |
| Minimum | 0.90% | 0.30% |
| Maximum | 23.5% | 60.0% |
| Range | 22.6% | 59.7% |
| Mean | 5.4% | 7.7% |
| Median | 4.5% | 5.9% |
| Interquartile 25% (IQ1) | 2.7% | 4.9% |
| Interquartile 75% (IQ3) | 5.4% | 8.4% |
| Interquartile Range (IQR) | 2.7% | 3.5% |
| Standard Deviation (Sample) | 4.5% | 8.1% |
| Standard Deviation (Population) | 4.5% | 8.0% |
Similar Demographics by Unemployment Among Ages 60 to 64 years
Demographics Similar to Immigrants from Jordan by Unemployment Among Ages 60 to 64 years
In terms of unemployment among ages 60 to 64 years, the demographic groups most similar to Immigrants from Jordan are Immigrants from Oceania (4.7%, a difference of 0.040%), Thai (4.7%, a difference of 0.060%), Immigrants from Sri Lanka (4.7%, a difference of 0.060%), Immigrants from Bulgaria (4.7%, a difference of 0.070%), and Immigrants from Northern Africa (4.7%, a difference of 0.070%).
| Demographics | Rating | Rank | Unemployment Among Ages 60 to 64 years |
| Icelanders | 99.1 /100 | #80 | Exceptional 4.7% |
| Iroquois | 99.1 /100 | #81 | Exceptional 4.7% |
| Okinawans | 99.1 /100 | #82 | Exceptional 4.7% |
| Immigrants | Egypt | 99.1 /100 | #83 | Exceptional 4.7% |
| Thais | 98.9 /100 | #84 | Exceptional 4.7% |
| Immigrants | Sri Lanka | 98.9 /100 | #85 | Exceptional 4.7% |
| Immigrants | Oceania | 98.9 /100 | #86 | Exceptional 4.7% |
| Immigrants | Jordan | 98.8 /100 | #87 | Exceptional 4.7% |
| Immigrants | Bulgaria | 98.7 /100 | #88 | Exceptional 4.7% |
| Immigrants | Northern Africa | 98.7 /100 | #89 | Exceptional 4.7% |
| Immigrants | Liberia | 98.7 /100 | #90 | Exceptional 4.7% |
| Immigrants | Uganda | 98.4 /100 | #91 | Exceptional 4.7% |
| Romanians | 98.4 /100 | #92 | Exceptional 4.7% |
| Immigrants | Saudi Arabia | 98.3 /100 | #93 | Exceptional 4.7% |
| Immigrants | Kuwait | 98.3 /100 | #94 | Exceptional 4.7% |
Demographics Similar to Ecuadorians by Unemployment Among Ages 60 to 64 years
In terms of unemployment among ages 60 to 64 years, the demographic groups most similar to Ecuadorians are Dutch West Indian (5.7%, a difference of 0.39%), Colville (5.7%, a difference of 0.44%), Alsatian (5.8%, a difference of 0.61%), Immigrants from Ecuador (5.8%, a difference of 0.96%), and Paiute (5.8%, a difference of 0.96%).
| Demographics | Rating | Rank | Unemployment Among Ages 60 to 64 years |
| Cree | 0.0 /100 | #315 | Tragic 5.6% |
| Cheyenne | 0.0 /100 | #316 | Tragic 5.6% |
| Shoshone | 0.0 /100 | #317 | Tragic 5.7% |
| Natives/Alaskans | 0.0 /100 | #318 | Tragic 5.7% |
| Immigrants | Belize | 0.0 /100 | #319 | Tragic 5.7% |
| Colville | 0.0 /100 | #320 | Tragic 5.7% |
| Dutch West Indians | 0.0 /100 | #321 | Tragic 5.7% |
| Ecuadorians | 0.0 /100 | #322 | Tragic 5.8% |
| Alsatians | 0.0 /100 | #323 | Tragic 5.8% |
| Immigrants | Ecuador | 0.0 /100 | #324 | Tragic 5.8% |
| Paiute | 0.0 /100 | #325 | Tragic 5.8% |
| Immigrants | St. Vincent and the Grenadines | 0.0 /100 | #326 | Tragic 5.9% |
| Immigrants | Grenada | 0.0 /100 | #327 | Tragic 5.9% |
| Apache | 0.0 /100 | #328 | Tragic 6.0% |
| Immigrants | Bangladesh | 0.0 /100 | #329 | Tragic 6.0% |