Immigrants from Italy vs Immigrants from Sierra Leone Seniors Poverty Over the Age of 75
COMPARE
Immigrants from Italy
Immigrants from Sierra Leone
Seniors Poverty Over the Age of 75
Seniors Poverty Over the Age of 75 Comparison
Immigrants from Italy
Immigrants from Sierra Leone
11.8%
SENIORS POVERTY OVER THE AGE OF 75
84.0/ 100
METRIC RATING
123rd/ 347
METRIC RANK
11.9%
SENIORS POVERTY OVER THE AGE OF 75
77.6/ 100
METRIC RATING
133rd/ 347
METRIC RANK
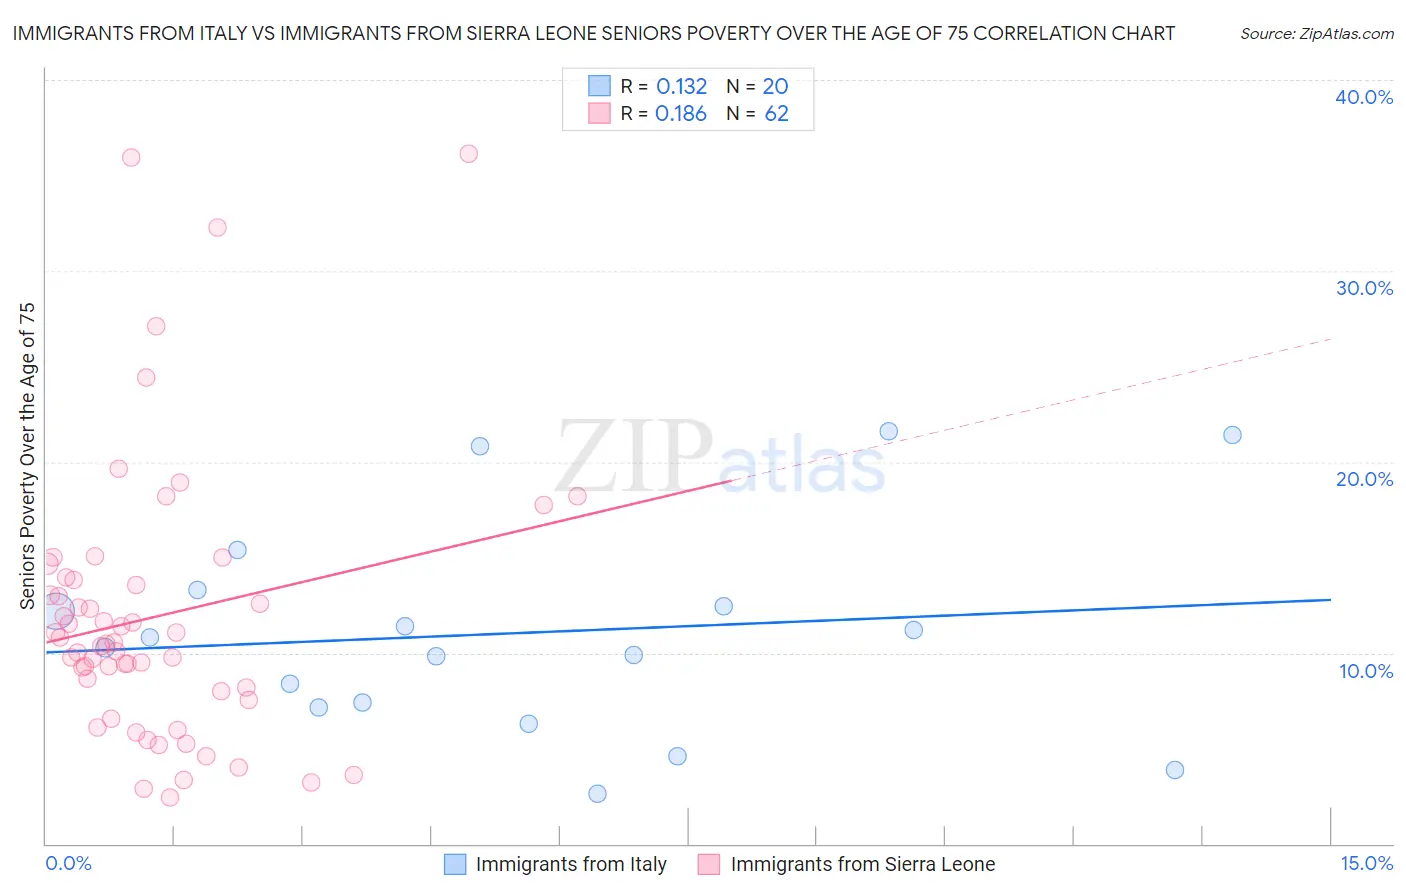
Immigrants from Italy vs Immigrants from Sierra Leone Seniors Poverty Over the Age of 75 Correlation Chart
The statistical analysis conducted on geographies consisting of 321,525,031 people shows a poor positive correlation between the proportion of Immigrants from Italy and poverty level among seniors over the age of 75 in the United States with a correlation coefficient (R) of 0.132 and weighted average of 11.8%. Similarly, the statistical analysis conducted on geographies consisting of 101,208,220 people shows a poor positive correlation between the proportion of Immigrants from Sierra Leone and poverty level among seniors over the age of 75 in the United States with a correlation coefficient (R) of 0.186 and weighted average of 11.9%, a difference of 0.87%.
Seniors Poverty Over the Age of 75 Correlation Summary
| Measurement | Immigrants from Italy | Immigrants from Sierra Leone |
| Minimum | 2.6% | 2.4% |
| Maximum | 21.6% | 36.1% |
| Range | 19.0% | 33.7% |
| Mean | 11.0% | 11.9% |
| Median | 10.5% | 10.5% |
| Interquartile 25% (IQ1) | 7.3% | 8.0% |
| Interquartile 75% (IQ3) | 12.9% | 13.8% |
| Interquartile Range (IQR) | 5.6% | 5.8% |
| Standard Deviation (Sample) | 5.5% | 7.2% |
| Standard Deviation (Population) | 5.3% | 7.1% |
Demographics Similar to Immigrants from Italy and Immigrants from Sierra Leone by Seniors Poverty Over the Age of 75
In terms of seniors poverty over the age of 75, the demographic groups most similar to Immigrants from Italy are Pakistani (11.8%, a difference of 0.0%), Malaysian (11.8%, a difference of 0.010%), Fijian (11.8%, a difference of 0.030%), Sudanese (11.8%, a difference of 0.060%), and Immigrants from Nepal (11.8%, a difference of 0.090%). Similarly, the demographic groups most similar to Immigrants from Sierra Leone are Ugandan (11.9%, a difference of 0.060%), Lebanese (11.9%, a difference of 0.090%), Immigrants from Ireland (11.9%, a difference of 0.16%), Immigrants from Western Europe (11.9%, a difference of 0.25%), and Immigrants from Philippines (11.9%, a difference of 0.30%).
| Demographics | Rating | Rank | Seniors Poverty Over the Age of 75 |
| Immigrants | Zimbabwe | 85.5 /100 | #118 | Excellent 11.7% |
| Immigrants | Uganda | 84.8 /100 | #119 | Excellent 11.8% |
| Immigrants | Nepal | 84.5 /100 | #120 | Excellent 11.8% |
| Malaysians | 84.1 /100 | #121 | Excellent 11.8% |
| Pakistanis | 84.0 /100 | #122 | Excellent 11.8% |
| Immigrants | Italy | 84.0 /100 | #123 | Excellent 11.8% |
| Fijians | 83.8 /100 | #124 | Excellent 11.8% |
| Sudanese | 83.6 /100 | #125 | Excellent 11.8% |
| Pennsylvania Germans | 83.4 /100 | #126 | Excellent 11.8% |
| Immigrants | Denmark | 82.6 /100 | #127 | Excellent 11.8% |
| Immigrants | Hungary | 81.7 /100 | #128 | Excellent 11.8% |
| Ethiopians | 80.7 /100 | #129 | Excellent 11.8% |
| Spanish | 80.5 /100 | #130 | Excellent 11.8% |
| Immigrants | Western Europe | 79.6 /100 | #131 | Good 11.9% |
| Lebanese | 78.3 /100 | #132 | Good 11.9% |
| Immigrants | Sierra Leone | 77.6 /100 | #133 | Good 11.9% |
| Ugandans | 77.1 /100 | #134 | Good 11.9% |
| Immigrants | Ireland | 76.2 /100 | #135 | Good 11.9% |
| Immigrants | Philippines | 75.0 /100 | #136 | Good 11.9% |
| Immigrants | Moldova | 74.1 /100 | #137 | Good 11.9% |
| Immigrants | Romania | 72.6 /100 | #138 | Good 11.9% |