Immigrants from Ireland vs Immigrants from Oceania Unemployment Among Women with Children Ages 6 to 17 years
COMPARE
Immigrants from Ireland
Immigrants from Oceania
Unemployment Among Women with Children Ages 6 to 17 years
Unemployment Among Women with Children Ages 6 to 17 years Comparison
Immigrants from Ireland
Immigrants from Oceania
8.7%
UNEMPLOYMENT AMONG WOMEN WITH CHILDREN AGES 6 TO 17 YEARS
91.0/ 100
METRIC RATING
134th/ 347
METRIC RANK
8.1%
UNEMPLOYMENT AMONG WOMEN WITH CHILDREN AGES 6 TO 17 YEARS
100.0/ 100
METRIC RATING
49th/ 347
METRIC RANK
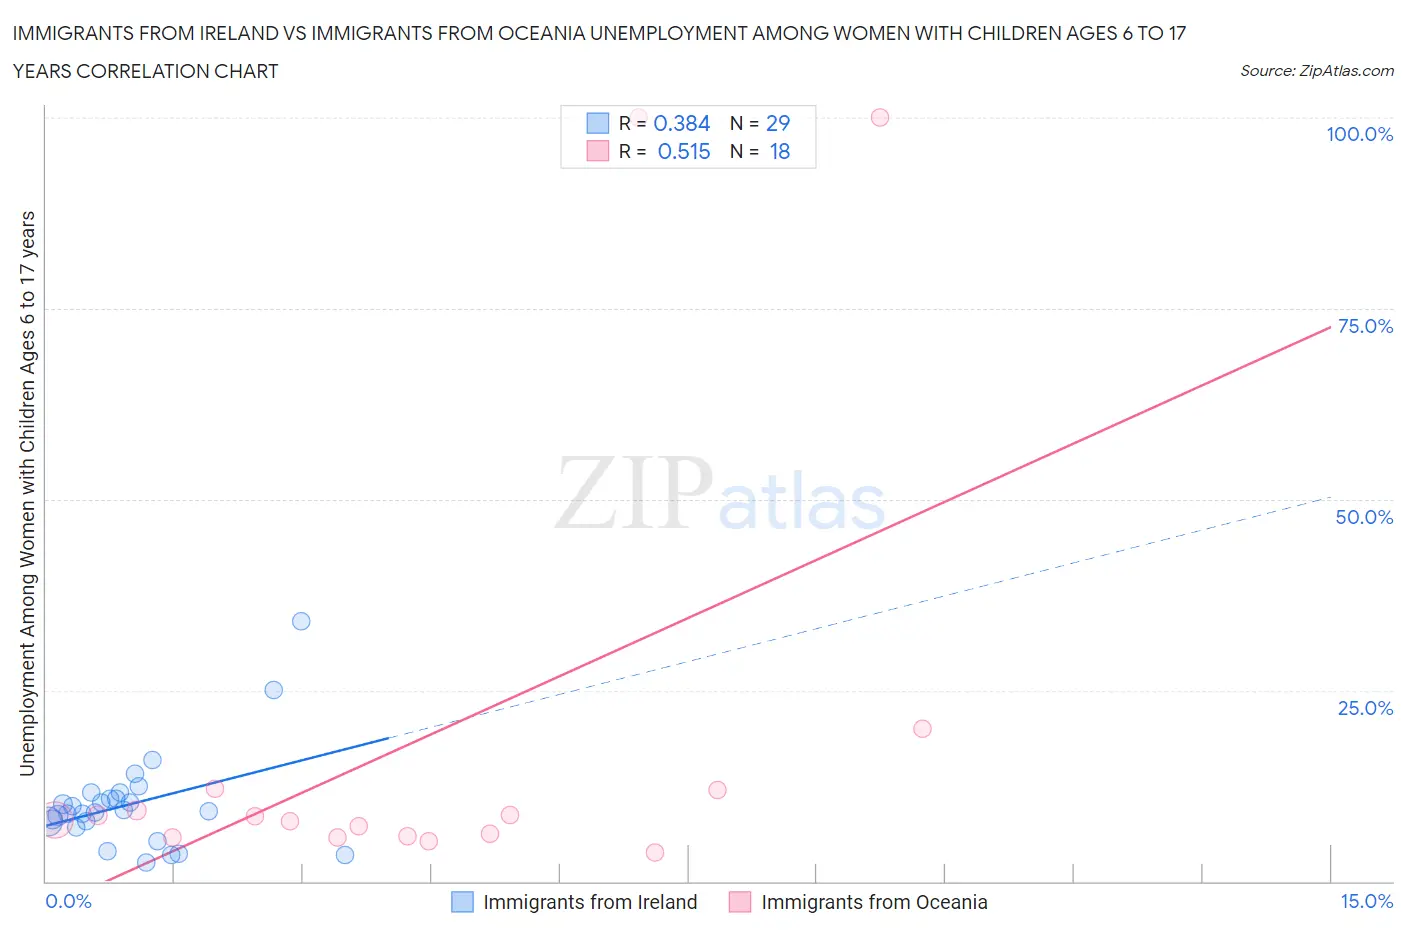
Immigrants from Ireland vs Immigrants from Oceania Unemployment Among Women with Children Ages 6 to 17 years Correlation Chart
The statistical analysis conducted on geographies consisting of 183,056,038 people shows a mild positive correlation between the proportion of Immigrants from Ireland and unemployment rate among women with children between the ages 6 and 17 in the United States with a correlation coefficient (R) of 0.384 and weighted average of 8.7%. Similarly, the statistical analysis conducted on geographies consisting of 229,741,233 people shows a substantial positive correlation between the proportion of Immigrants from Oceania and unemployment rate among women with children between the ages 6 and 17 in the United States with a correlation coefficient (R) of 0.515 and weighted average of 8.1%, a difference of 8.0%.
Unemployment Among Women with Children Ages 6 to 17 years Correlation Summary
| Measurement | Immigrants from Ireland | Immigrants from Oceania |
| Minimum | 2.4% | 3.7% |
| Maximum | 34.1% | 100.0% |
| Range | 31.7% | 96.3% |
| Mean | 10.1% | 18.6% |
| Median | 9.1% | 8.3% |
| Interquartile 25% (IQ1) | 7.5% | 5.8% |
| Interquartile 75% (IQ3) | 11.2% | 12.0% |
| Interquartile Range (IQR) | 3.7% | 6.2% |
| Standard Deviation (Sample) | 6.4% | 29.8% |
| Standard Deviation (Population) | 6.3% | 29.0% |
Similar Demographics by Unemployment Among Women with Children Ages 6 to 17 years
Demographics Similar to Immigrants from Ireland by Unemployment Among Women with Children Ages 6 to 17 years
In terms of unemployment among women with children ages 6 to 17 years, the demographic groups most similar to Immigrants from Ireland are European (8.7%, a difference of 0.060%), Immigrants from Latvia (8.7%, a difference of 0.090%), Egyptian (8.7%, a difference of 0.11%), Immigrants from Argentina (8.7%, a difference of 0.14%), and Yaqui (8.7%, a difference of 0.17%).
| Demographics | Rating | Rank | Unemployment Among Women with Children Ages 6 to 17 years |
| Czechs | 94.4 /100 | #127 | Exceptional 8.7% |
| Hmong | 94.3 /100 | #128 | Exceptional 8.7% |
| Barbadians | 93.8 /100 | #129 | Exceptional 8.7% |
| Immigrants | Western Asia | 93.1 /100 | #130 | Exceptional 8.7% |
| Slavs | 92.2 /100 | #131 | Exceptional 8.7% |
| Yaqui | 92.2 /100 | #132 | Exceptional 8.7% |
| Egyptians | 91.8 /100 | #133 | Exceptional 8.7% |
| Immigrants | Ireland | 91.0 /100 | #134 | Exceptional 8.7% |
| Europeans | 90.6 /100 | #135 | Exceptional 8.7% |
| Immigrants | Latvia | 90.4 /100 | #136 | Exceptional 8.7% |
| Immigrants | Argentina | 90.0 /100 | #137 | Excellent 8.7% |
| Immigrants | Ethiopia | 89.5 /100 | #138 | Excellent 8.8% |
| Northern Europeans | 89.2 /100 | #139 | Excellent 8.8% |
| Immigrants | Poland | 88.3 /100 | #140 | Excellent 8.8% |
| Serbians | 87.6 /100 | #141 | Excellent 8.8% |
Demographics Similar to Immigrants from Oceania by Unemployment Among Women with Children Ages 6 to 17 years
In terms of unemployment among women with children ages 6 to 17 years, the demographic groups most similar to Immigrants from Oceania are Immigrants from Asia (8.1%, a difference of 0.060%), Hawaiian (8.1%, a difference of 0.11%), Immigrants from Switzerland (8.1%, a difference of 0.18%), Icelander (8.1%, a difference of 0.23%), and Immigrants from Bulgaria (8.1%, a difference of 0.24%).
| Demographics | Rating | Rank | Unemployment Among Women with Children Ages 6 to 17 years |
| Immigrants | Somalia | 100.0 /100 | #42 | Exceptional 8.0% |
| Bhutanese | 100.0 /100 | #43 | Exceptional 8.1% |
| Immigrants | Sweden | 100.0 /100 | #44 | Exceptional 8.1% |
| Immigrants | Bulgaria | 100.0 /100 | #45 | Exceptional 8.1% |
| Icelanders | 100.0 /100 | #46 | Exceptional 8.1% |
| Immigrants | Switzerland | 100.0 /100 | #47 | Exceptional 8.1% |
| Immigrants | Asia | 100.0 /100 | #48 | Exceptional 8.1% |
| Immigrants | Oceania | 100.0 /100 | #49 | Exceptional 8.1% |
| Hawaiians | 100.0 /100 | #50 | Exceptional 8.1% |
| Immigrants | Sudan | 100.0 /100 | #51 | Exceptional 8.1% |
| Immigrants | Iraq | 100.0 /100 | #52 | Exceptional 8.1% |
| Danes | 100.0 /100 | #53 | Exceptional 8.1% |
| Immigrants | Armenia | 100.0 /100 | #54 | Exceptional 8.2% |
| Immigrants | Japan | 100.0 /100 | #55 | Exceptional 8.2% |
| Immigrants | Bosnia and Herzegovina | 100.0 /100 | #56 | Exceptional 8.2% |