Immigrants from Guatemala vs Finnish Male Unemployment
COMPARE
Immigrants from Guatemala
Finnish
Male Unemployment
Male Unemployment Comparison
Immigrants from Guatemala
Finns
5.6%
MALE UNEMPLOYMENT
1.1/ 100
METRIC RATING
239th/ 347
METRIC RANK
5.0%
MALE UNEMPLOYMENT
97.5/ 100
METRIC RATING
66th/ 347
METRIC RANK
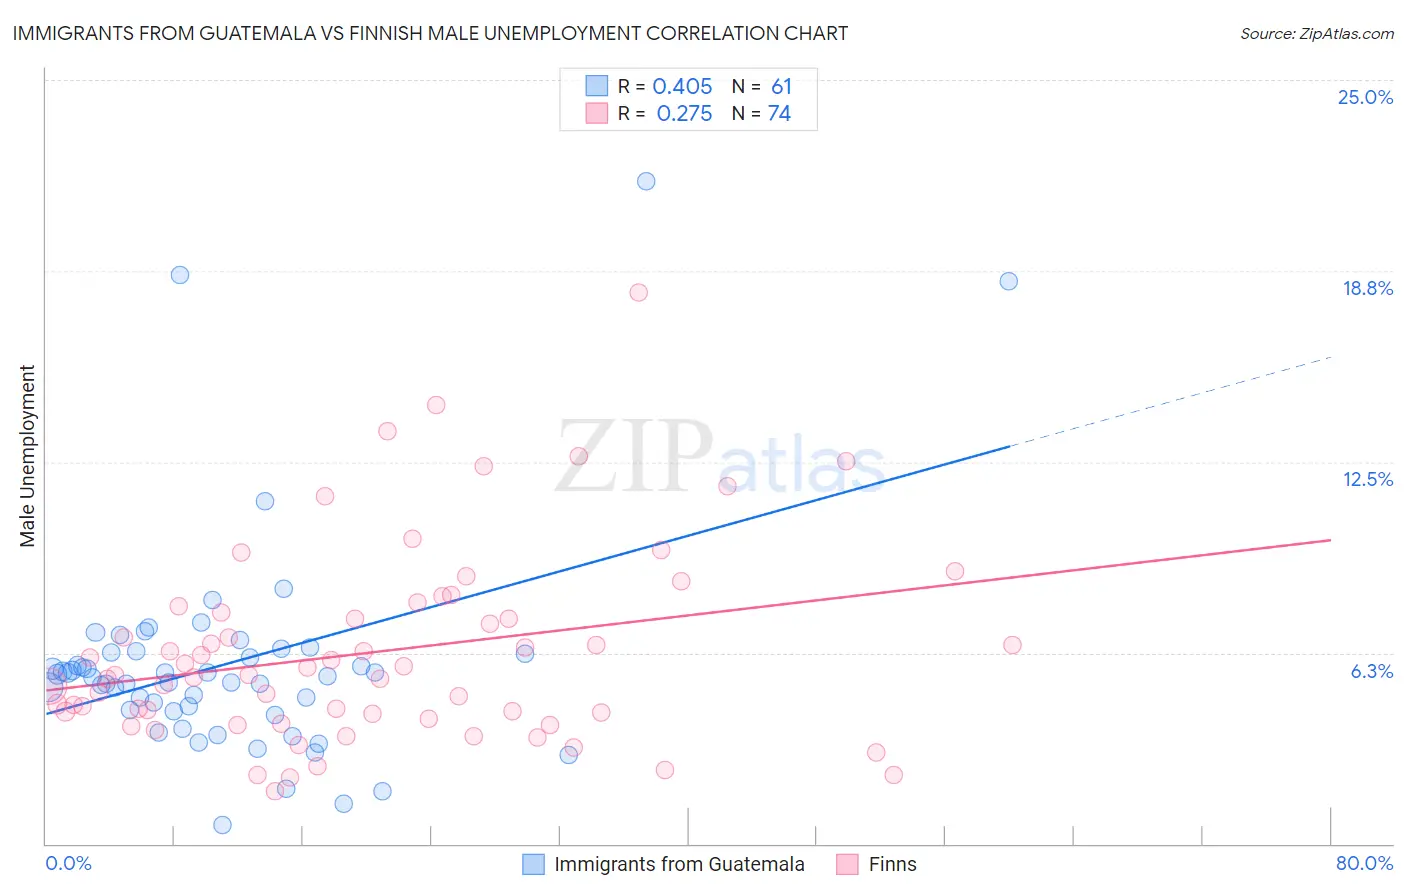
Immigrants from Guatemala vs Finnish Male Unemployment Correlation Chart
The statistical analysis conducted on geographies consisting of 375,961,027 people shows a moderate positive correlation between the proportion of Immigrants from Guatemala and unemployment rate among males in the United States with a correlation coefficient (R) of 0.405 and weighted average of 5.6%. Similarly, the statistical analysis conducted on geographies consisting of 401,956,415 people shows a weak positive correlation between the proportion of Finns and unemployment rate among males in the United States with a correlation coefficient (R) of 0.275 and weighted average of 5.0%, a difference of 12.6%.
Male Unemployment Correlation Summary
| Measurement | Immigrants from Guatemala | Finnish |
| Minimum | 0.60% | 1.7% |
| Maximum | 21.7% | 18.1% |
| Range | 21.1% | 16.3% |
| Mean | 5.9% | 6.3% |
| Median | 5.5% | 5.5% |
| Interquartile 25% (IQ1) | 4.3% | 4.3% |
| Interquartile 75% (IQ3) | 6.3% | 7.6% |
| Interquartile Range (IQR) | 1.9% | 3.3% |
| Standard Deviation (Sample) | 3.6% | 3.2% |
| Standard Deviation (Population) | 3.6% | 3.2% |
Similar Demographics by Male Unemployment
Demographics Similar to Immigrants from Guatemala by Male Unemployment
In terms of male unemployment, the demographic groups most similar to Immigrants from Guatemala are Native Hawaiian (5.6%, a difference of 0.0%), Honduran (5.6%, a difference of 0.050%), Immigrants from Cameroon (5.6%, a difference of 0.070%), Salvadoran (5.7%, a difference of 0.11%), and Guatemalan (5.6%, a difference of 0.14%).
| Demographics | Rating | Rank | Male Unemployment |
| Moroccans | 1.6 /100 | #232 | Tragic 5.6% |
| Somalis | 1.5 /100 | #233 | Tragic 5.6% |
| Immigrants | Somalia | 1.5 /100 | #234 | Tragic 5.6% |
| Immigrants | Honduras | 1.5 /100 | #235 | Tragic 5.6% |
| Guatemalans | 1.2 /100 | #236 | Tragic 5.6% |
| Hondurans | 1.1 /100 | #237 | Tragic 5.6% |
| Native Hawaiians | 1.1 /100 | #238 | Tragic 5.6% |
| Immigrants | Guatemala | 1.1 /100 | #239 | Tragic 5.6% |
| Immigrants | Cameroon | 1.0 /100 | #240 | Tragic 5.6% |
| Salvadorans | 1.0 /100 | #241 | Tragic 5.7% |
| Ottawa | 0.9 /100 | #242 | Tragic 5.7% |
| Bangladeshis | 0.8 /100 | #243 | Tragic 5.7% |
| Immigrants | El Salvador | 0.7 /100 | #244 | Tragic 5.7% |
| Yaqui | 0.7 /100 | #245 | Tragic 5.7% |
| Iroquois | 0.6 /100 | #246 | Tragic 5.7% |
Demographics Similar to Finns by Male Unemployment
In terms of male unemployment, the demographic groups most similar to Finns are Immigrants from Canada (5.0%, a difference of 0.020%), Australian (5.0%, a difference of 0.030%), Immigrants from Sweden (5.0%, a difference of 0.060%), Icelander (5.0%, a difference of 0.090%), and White/Caucasian (5.0%, a difference of 0.11%).
| Demographics | Rating | Rank | Male Unemployment |
| Immigrants | Netherlands | 98.3 /100 | #59 | Exceptional 5.0% |
| Immigrants | Argentina | 98.1 /100 | #60 | Exceptional 5.0% |
| Cambodians | 98.1 /100 | #61 | Exceptional 5.0% |
| Basques | 97.9 /100 | #62 | Exceptional 5.0% |
| Eastern Europeans | 97.9 /100 | #63 | Exceptional 5.0% |
| Celtics | 97.8 /100 | #64 | Exceptional 5.0% |
| Icelanders | 97.6 /100 | #65 | Exceptional 5.0% |
| Finns | 97.5 /100 | #66 | Exceptional 5.0% |
| Immigrants | Canada | 97.5 /100 | #67 | Exceptional 5.0% |
| Australians | 97.4 /100 | #68 | Exceptional 5.0% |
| Immigrants | Sweden | 97.4 /100 | #69 | Exceptional 5.0% |
| Whites/Caucasians | 97.3 /100 | #70 | Exceptional 5.0% |
| New Zealanders | 97.3 /100 | #71 | Exceptional 5.0% |
| Immigrants | South Africa | 97.1 /100 | #72 | Exceptional 5.0% |
| Greeks | 97.0 /100 | #73 | Exceptional 5.0% |