Black/African American vs Finnish Male Unemployment
COMPARE
Black/African American
Finnish
Male Unemployment
Male Unemployment Comparison
Blacks/African Americans
Finns
6.9%
MALE UNEMPLOYMENT
0.0/ 100
METRIC RATING
310th/ 347
METRIC RANK
5.0%
MALE UNEMPLOYMENT
97.5/ 100
METRIC RATING
66th/ 347
METRIC RANK
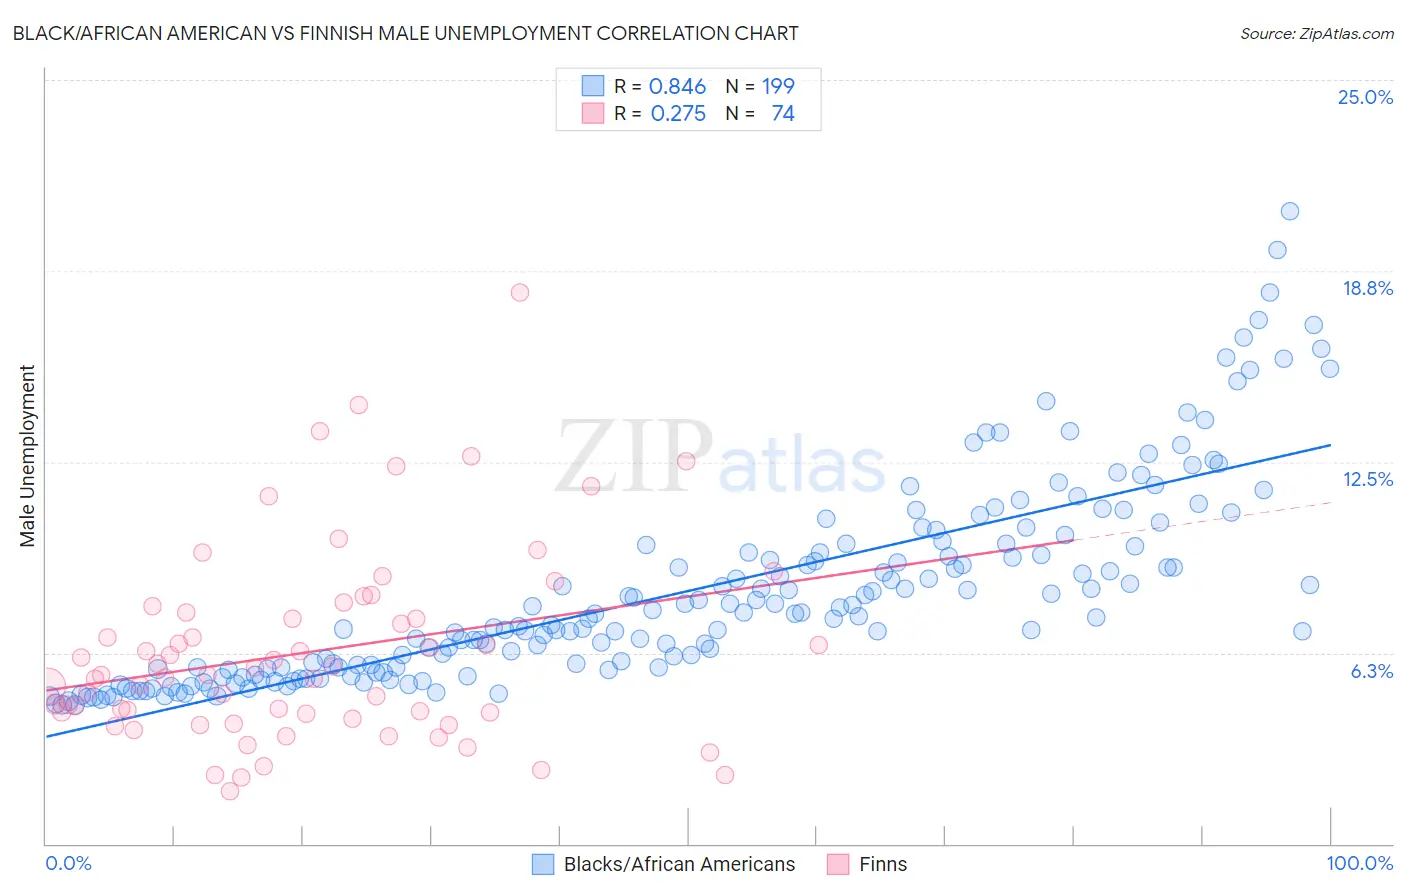
Black/African American vs Finnish Male Unemployment Correlation Chart
The statistical analysis conducted on geographies consisting of 557,031,145 people shows a very strong positive correlation between the proportion of Blacks/African Americans and unemployment rate among males in the United States with a correlation coefficient (R) of 0.846 and weighted average of 6.9%. Similarly, the statistical analysis conducted on geographies consisting of 401,956,415 people shows a weak positive correlation between the proportion of Finns and unemployment rate among males in the United States with a correlation coefficient (R) of 0.275 and weighted average of 5.0%, a difference of 37.6%.
Male Unemployment Correlation Summary
| Measurement | Black/African American | Finnish |
| Minimum | 4.5% | 1.7% |
| Maximum | 20.7% | 18.1% |
| Range | 16.2% | 16.3% |
| Mean | 8.3% | 6.3% |
| Median | 7.4% | 5.5% |
| Interquartile 25% (IQ1) | 5.7% | 4.3% |
| Interquartile 75% (IQ3) | 9.7% | 7.6% |
| Interquartile Range (IQR) | 4.0% | 3.3% |
| Standard Deviation (Sample) | 3.3% | 3.2% |
| Standard Deviation (Population) | 3.2% | 3.2% |
Similar Demographics by Male Unemployment
Demographics Similar to Blacks/African Americans by Male Unemployment
In terms of male unemployment, the demographic groups most similar to Blacks/African Americans are Immigrants from Armenia (6.9%, a difference of 0.31%), Lumbee (6.9%, a difference of 0.52%), Barbadian (6.9%, a difference of 0.64%), Aleut (6.8%, a difference of 1.1%), and Immigrants from Dominica (7.0%, a difference of 1.6%).
| Demographics | Rating | Rank | Male Unemployment |
| Immigrants | West Indies | 0.0 /100 | #303 | Tragic 6.7% |
| West Indians | 0.0 /100 | #304 | Tragic 6.7% |
| Trinidadians and Tobagonians | 0.0 /100 | #305 | Tragic 6.7% |
| Immigrants | Trinidad and Tobago | 0.0 /100 | #306 | Tragic 6.7% |
| Immigrants | Jamaica | 0.0 /100 | #307 | Tragic 6.7% |
| Aleuts | 0.0 /100 | #308 | Tragic 6.8% |
| Barbadians | 0.0 /100 | #309 | Tragic 6.9% |
| Blacks/African Americans | 0.0 /100 | #310 | Tragic 6.9% |
| Immigrants | Armenia | 0.0 /100 | #311 | Tragic 6.9% |
| Lumbee | 0.0 /100 | #312 | Tragic 6.9% |
| Immigrants | Dominica | 0.0 /100 | #313 | Tragic 7.0% |
| Immigrants | Barbados | 0.0 /100 | #314 | Tragic 7.1% |
| Houma | 0.0 /100 | #315 | Tragic 7.1% |
| Immigrants | Guyana | 0.0 /100 | #316 | Tragic 7.1% |
| Guyanese | 0.0 /100 | #317 | Tragic 7.1% |
Demographics Similar to Finns by Male Unemployment
In terms of male unemployment, the demographic groups most similar to Finns are Immigrants from Canada (5.0%, a difference of 0.020%), Australian (5.0%, a difference of 0.030%), Immigrants from Sweden (5.0%, a difference of 0.060%), Icelander (5.0%, a difference of 0.090%), and White/Caucasian (5.0%, a difference of 0.11%).
| Demographics | Rating | Rank | Male Unemployment |
| Immigrants | Netherlands | 98.3 /100 | #59 | Exceptional 5.0% |
| Immigrants | Argentina | 98.1 /100 | #60 | Exceptional 5.0% |
| Cambodians | 98.1 /100 | #61 | Exceptional 5.0% |
| Basques | 97.9 /100 | #62 | Exceptional 5.0% |
| Eastern Europeans | 97.9 /100 | #63 | Exceptional 5.0% |
| Celtics | 97.8 /100 | #64 | Exceptional 5.0% |
| Icelanders | 97.6 /100 | #65 | Exceptional 5.0% |
| Finns | 97.5 /100 | #66 | Exceptional 5.0% |
| Immigrants | Canada | 97.5 /100 | #67 | Exceptional 5.0% |
| Australians | 97.4 /100 | #68 | Exceptional 5.0% |
| Immigrants | Sweden | 97.4 /100 | #69 | Exceptional 5.0% |
| Whites/Caucasians | 97.3 /100 | #70 | Exceptional 5.0% |
| New Zealanders | 97.3 /100 | #71 | Exceptional 5.0% |
| Immigrants | South Africa | 97.1 /100 | #72 | Exceptional 5.0% |
| Greeks | 97.0 /100 | #73 | Exceptional 5.0% |