Immigrants from Germany vs Immigrants from West Indies Unemployment Among Seniors over 65 years
COMPARE
Immigrants from Germany
Immigrants from West Indies
Unemployment Among Seniors over 65 years
Unemployment Among Seniors over 65 years Comparison
Immigrants from Germany
Immigrants from West Indies
5.0%
UNEMPLOYMENT AMONG SENIORS OVER 65 YEARS
93.2/ 100
METRIC RATING
107th/ 347
METRIC RANK
5.6%
UNEMPLOYMENT AMONG SENIORS OVER 65 YEARS
0.0/ 100
METRIC RATING
298th/ 347
METRIC RANK
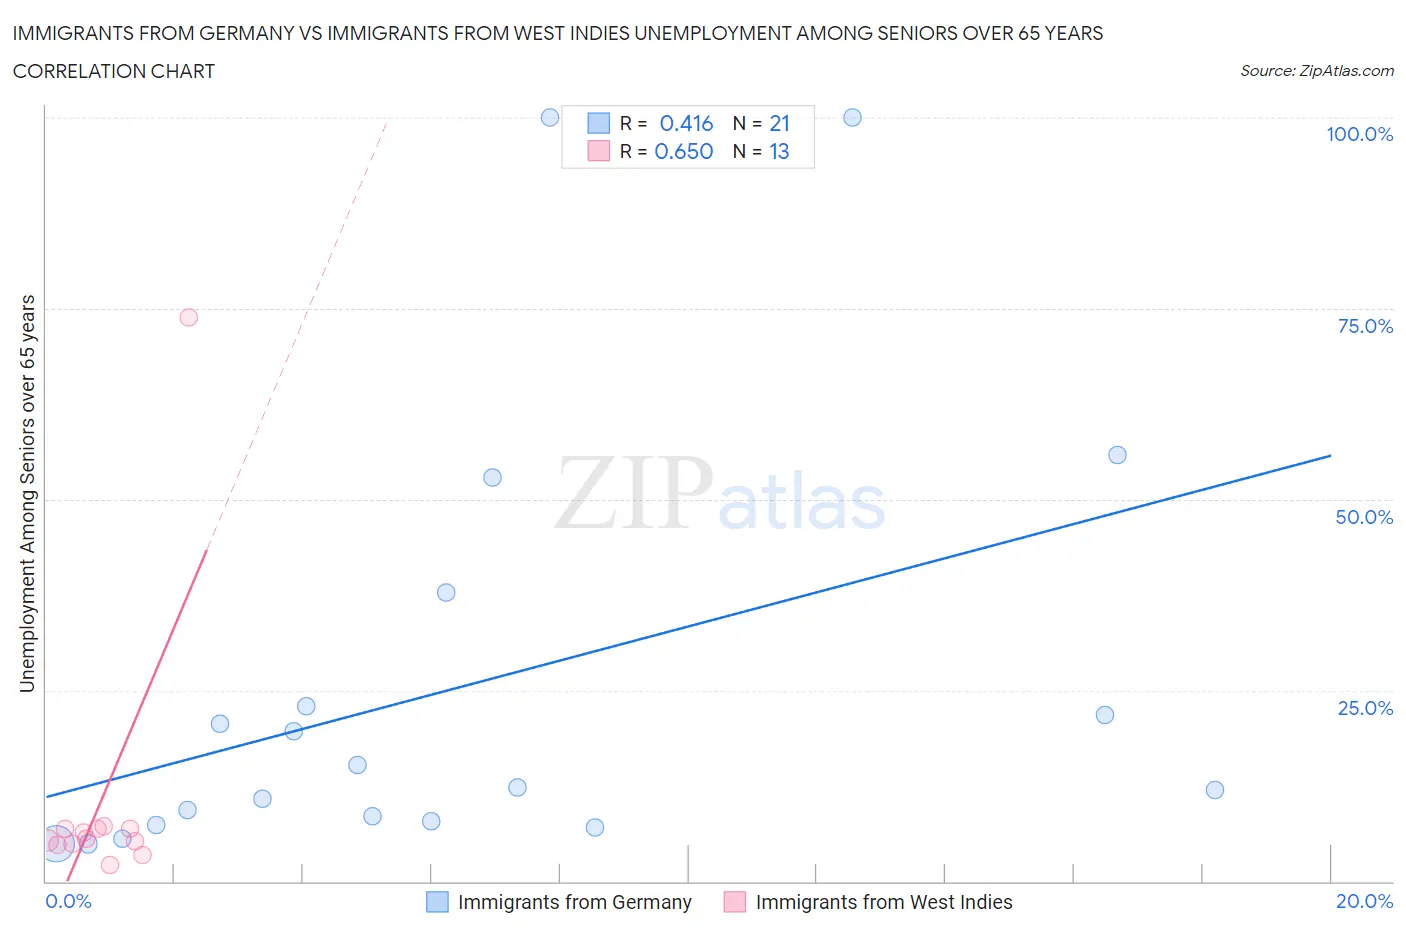
Immigrants from Germany vs Immigrants from West Indies Unemployment Among Seniors over 65 years Correlation Chart
The statistical analysis conducted on geographies consisting of 406,403,898 people shows a moderate positive correlation between the proportion of Immigrants from Germany and unemployment rate amomg seniors over the age of 65 in the United States with a correlation coefficient (R) of 0.416 and weighted average of 5.0%. Similarly, the statistical analysis conducted on geographies consisting of 71,058,971 people shows a significant positive correlation between the proportion of Immigrants from West Indies and unemployment rate amomg seniors over the age of 65 in the United States with a correlation coefficient (R) of 0.650 and weighted average of 5.6%, a difference of 10.2%.
Unemployment Among Seniors over 65 years Correlation Summary
| Measurement | Immigrants from Germany | Immigrants from West Indies |
| Minimum | 4.9% | 2.2% |
| Maximum | 100.0% | 73.8% |
| Range | 95.1% | 71.6% |
| Mean | 25.6% | 10.7% |
| Median | 12.3% | 5.6% |
| Interquartile 25% (IQ1) | 7.7% | 4.9% |
| Interquartile 75% (IQ3) | 30.3% | 6.9% |
| Interquartile Range (IQR) | 22.7% | 2.0% |
| Standard Deviation (Sample) | 28.7% | 19.0% |
| Standard Deviation (Population) | 28.0% | 18.3% |
Similar Demographics by Unemployment Among Seniors over 65 years
Demographics Similar to Immigrants from Germany by Unemployment Among Seniors over 65 years
In terms of unemployment among seniors over 65 years, the demographic groups most similar to Immigrants from Germany are Immigrants from Vietnam (5.0%, a difference of 0.030%), Immigrants from Malaysia (5.0%, a difference of 0.050%), Immigrants from Saudi Arabia (5.0%, a difference of 0.060%), Finnish (5.0%, a difference of 0.12%), and Eastern European (5.0%, a difference of 0.14%).
| Demographics | Rating | Rank | Unemployment Among Seniors over 65 years |
| Romanians | 95.5 /100 | #100 | Exceptional 5.0% |
| Yugoslavians | 95.4 /100 | #101 | Exceptional 5.0% |
| Immigrants | Thailand | 95.4 /100 | #102 | Exceptional 5.0% |
| Immigrants | Lithuania | 95.1 /100 | #103 | Exceptional 5.0% |
| Immigrants | Scotland | 95.0 /100 | #104 | Exceptional 5.0% |
| Okinawans | 94.7 /100 | #105 | Exceptional 5.0% |
| Immigrants | Turkey | 94.3 /100 | #106 | Exceptional 5.0% |
| Immigrants | Germany | 93.2 /100 | #107 | Exceptional 5.0% |
| Immigrants | Vietnam | 92.9 /100 | #108 | Exceptional 5.0% |
| Immigrants | Malaysia | 92.7 /100 | #109 | Exceptional 5.0% |
| Immigrants | Saudi Arabia | 92.7 /100 | #110 | Exceptional 5.0% |
| Finns | 92.2 /100 | #111 | Exceptional 5.0% |
| Eastern Europeans | 92.0 /100 | #112 | Exceptional 5.0% |
| Seminole | 91.4 /100 | #113 | Exceptional 5.0% |
| Immigrants | Latvia | 91.4 /100 | #114 | Exceptional 5.0% |
Demographics Similar to Immigrants from West Indies by Unemployment Among Seniors over 65 years
In terms of unemployment among seniors over 65 years, the demographic groups most similar to Immigrants from West Indies are Guyanese (5.6%, a difference of 0.090%), Yaqui (5.5%, a difference of 0.12%), Cape Verdean (5.5%, a difference of 0.13%), Cheyenne (5.5%, a difference of 0.14%), and Zimbabwean (5.6%, a difference of 0.14%).
| Demographics | Rating | Rank | Unemployment Among Seniors over 65 years |
| Blacks/African Americans | 0.0 /100 | #291 | Tragic 5.5% |
| Belizeans | 0.0 /100 | #292 | Tragic 5.5% |
| Immigrants | Venezuela | 0.0 /100 | #293 | Tragic 5.5% |
| Armenians | 0.0 /100 | #294 | Tragic 5.5% |
| Cheyenne | 0.0 /100 | #295 | Tragic 5.5% |
| Cape Verdeans | 0.0 /100 | #296 | Tragic 5.5% |
| Yaqui | 0.0 /100 | #297 | Tragic 5.5% |
| Immigrants | West Indies | 0.0 /100 | #298 | Tragic 5.6% |
| Guyanese | 0.0 /100 | #299 | Tragic 5.6% |
| Zimbabweans | 0.0 /100 | #300 | Tragic 5.6% |
| Hispanics or Latinos | 0.0 /100 | #301 | Tragic 5.6% |
| Guatemalans | 0.0 /100 | #302 | Tragic 5.6% |
| Immigrants | Latin America | 0.0 /100 | #303 | Tragic 5.6% |
| Liberians | 0.0 /100 | #304 | Tragic 5.6% |
| Mexicans | 0.0 /100 | #305 | Tragic 5.6% |