Immigrants from France vs Immigrants from Burma/Myanmar Unemployment Among Women with Children Ages 6 to 17 years
COMPARE
Immigrants from France
Immigrants from Burma/Myanmar
Unemployment Among Women with Children Ages 6 to 17 years
Unemployment Among Women with Children Ages 6 to 17 years Comparison
Immigrants from France
Immigrants from Burma/Myanmar
8.6%
UNEMPLOYMENT AMONG WOMEN WITH CHILDREN AGES 6 TO 17 YEARS
98.0/ 100
METRIC RATING
104th/ 347
METRIC RANK
7.5%
UNEMPLOYMENT AMONG WOMEN WITH CHILDREN AGES 6 TO 17 YEARS
100.0/ 100
METRIC RATING
16th/ 347
METRIC RANK
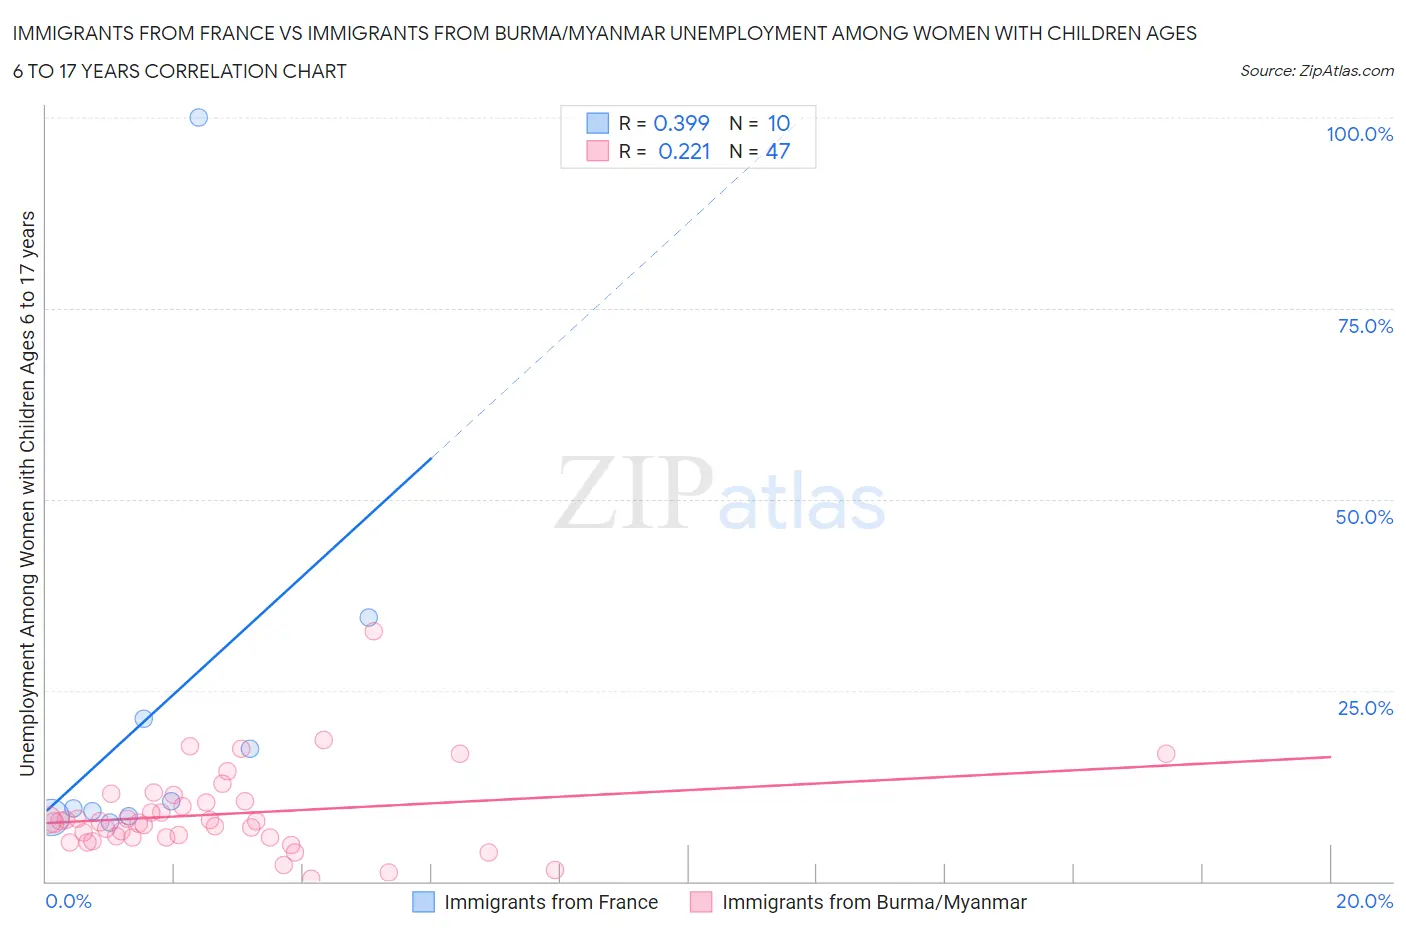
Immigrants from France vs Immigrants from Burma/Myanmar Unemployment Among Women with Children Ages 6 to 17 years Correlation Chart
The statistical analysis conducted on geographies consisting of 216,894,654 people shows a mild positive correlation between the proportion of Immigrants from France and unemployment rate among women with children between the ages 6 and 17 in the United States with a correlation coefficient (R) of 0.399 and weighted average of 8.6%. Similarly, the statistical analysis conducted on geographies consisting of 144,257,995 people shows a weak positive correlation between the proportion of Immigrants from Burma/Myanmar and unemployment rate among women with children between the ages 6 and 17 in the United States with a correlation coefficient (R) of 0.221 and weighted average of 7.5%, a difference of 14.1%.
Unemployment Among Women with Children Ages 6 to 17 years Correlation Summary
| Measurement | Immigrants from France | Immigrants from Burma/Myanmar |
| Minimum | 7.8% | 0.40% |
| Maximum | 100.0% | 32.8% |
| Range | 92.2% | 32.4% |
| Mean | 22.7% | 8.8% |
| Median | 10.0% | 7.8% |
| Interquartile 25% (IQ1) | 8.6% | 5.7% |
| Interquartile 75% (IQ3) | 21.3% | 10.4% |
| Interquartile Range (IQR) | 12.7% | 4.7% |
| Standard Deviation (Sample) | 28.5% | 5.6% |
| Standard Deviation (Population) | 27.0% | 5.5% |
Similar Demographics by Unemployment Among Women with Children Ages 6 to 17 years
Demographics Similar to Immigrants from France by Unemployment Among Women with Children Ages 6 to 17 years
In terms of unemployment among women with children ages 6 to 17 years, the demographic groups most similar to Immigrants from France are Immigrants from Norway (8.6%, a difference of 0.15%), Scandinavian (8.6%, a difference of 0.18%), Immigrants from South Africa (8.6%, a difference of 0.19%), Immigrants from Serbia (8.6%, a difference of 0.19%), and Immigrants from Lithuania (8.6%, a difference of 0.22%).
| Demographics | Rating | Rank | Unemployment Among Women with Children Ages 6 to 17 years |
| Bolivians | 98.5 /100 | #97 | Exceptional 8.5% |
| Malaysians | 98.5 /100 | #98 | Exceptional 8.6% |
| Immigrants | Lithuania | 98.4 /100 | #99 | Exceptional 8.6% |
| New Zealanders | 98.4 /100 | #100 | Exceptional 8.6% |
| Immigrants | Pakistan | 98.4 /100 | #101 | Exceptional 8.6% |
| Immigrants | South Africa | 98.3 /100 | #102 | Exceptional 8.6% |
| Scandinavians | 98.3 /100 | #103 | Exceptional 8.6% |
| Immigrants | France | 98.0 /100 | #104 | Exceptional 8.6% |
| Immigrants | Norway | 97.8 /100 | #105 | Exceptional 8.6% |
| Immigrants | Serbia | 97.7 /100 | #106 | Exceptional 8.6% |
| Chickasaw | 97.6 /100 | #107 | Exceptional 8.6% |
| Swedes | 97.6 /100 | #108 | Exceptional 8.6% |
| Immigrants | Romania | 97.5 /100 | #109 | Exceptional 8.6% |
| Latvians | 97.4 /100 | #110 | Exceptional 8.6% |
| Immigrants | Ukraine | 97.4 /100 | #111 | Exceptional 8.6% |
Demographics Similar to Immigrants from Burma/Myanmar by Unemployment Among Women with Children Ages 6 to 17 years
In terms of unemployment among women with children ages 6 to 17 years, the demographic groups most similar to Immigrants from Burma/Myanmar are Cambodian (7.5%, a difference of 0.18%), Puget Sound Salish (7.5%, a difference of 0.36%), Afghan (7.6%, a difference of 0.84%), Filipino (7.6%, a difference of 0.86%), and Sudanese (7.4%, a difference of 1.4%).
| Demographics | Rating | Rank | Unemployment Among Women with Children Ages 6 to 17 years |
| Assyrians/Chaldeans/Syriacs | 100.0 /100 | #9 | Exceptional 7.2% |
| Immigrants | Fiji | 100.0 /100 | #10 | Exceptional 7.3% |
| Immigrants | Taiwan | 100.0 /100 | #11 | Exceptional 7.3% |
| Bangladeshis | 100.0 /100 | #12 | Exceptional 7.4% |
| Indonesians | 100.0 /100 | #13 | Exceptional 7.4% |
| Sudanese | 100.0 /100 | #14 | Exceptional 7.4% |
| Puget Sound Salish | 100.0 /100 | #15 | Exceptional 7.5% |
| Immigrants | Burma/Myanmar | 100.0 /100 | #16 | Exceptional 7.5% |
| Cambodians | 100.0 /100 | #17 | Exceptional 7.5% |
| Afghans | 100.0 /100 | #18 | Exceptional 7.6% |
| Filipinos | 100.0 /100 | #19 | Exceptional 7.6% |
| Immigrants | Singapore | 100.0 /100 | #20 | Exceptional 7.7% |
| Immigrants | India | 100.0 /100 | #21 | Exceptional 7.7% |
| Immigrants | China | 100.0 /100 | #22 | Exceptional 7.7% |
| Immigrants | Indonesia | 100.0 /100 | #23 | Exceptional 7.7% |