Immigrants from Eastern Europe vs Cypriot Male Unemployment
COMPARE
Immigrants from Eastern Europe
Cypriot
Male Unemployment
Male Unemployment Comparison
Immigrants from Eastern Europe
Cypriots
5.3%
MALE UNEMPLOYMENT
54.1/ 100
METRIC RATING
170th/ 347
METRIC RANK
5.1%
MALE UNEMPLOYMENT
88.8/ 100
METRIC RATING
118th/ 347
METRIC RANK
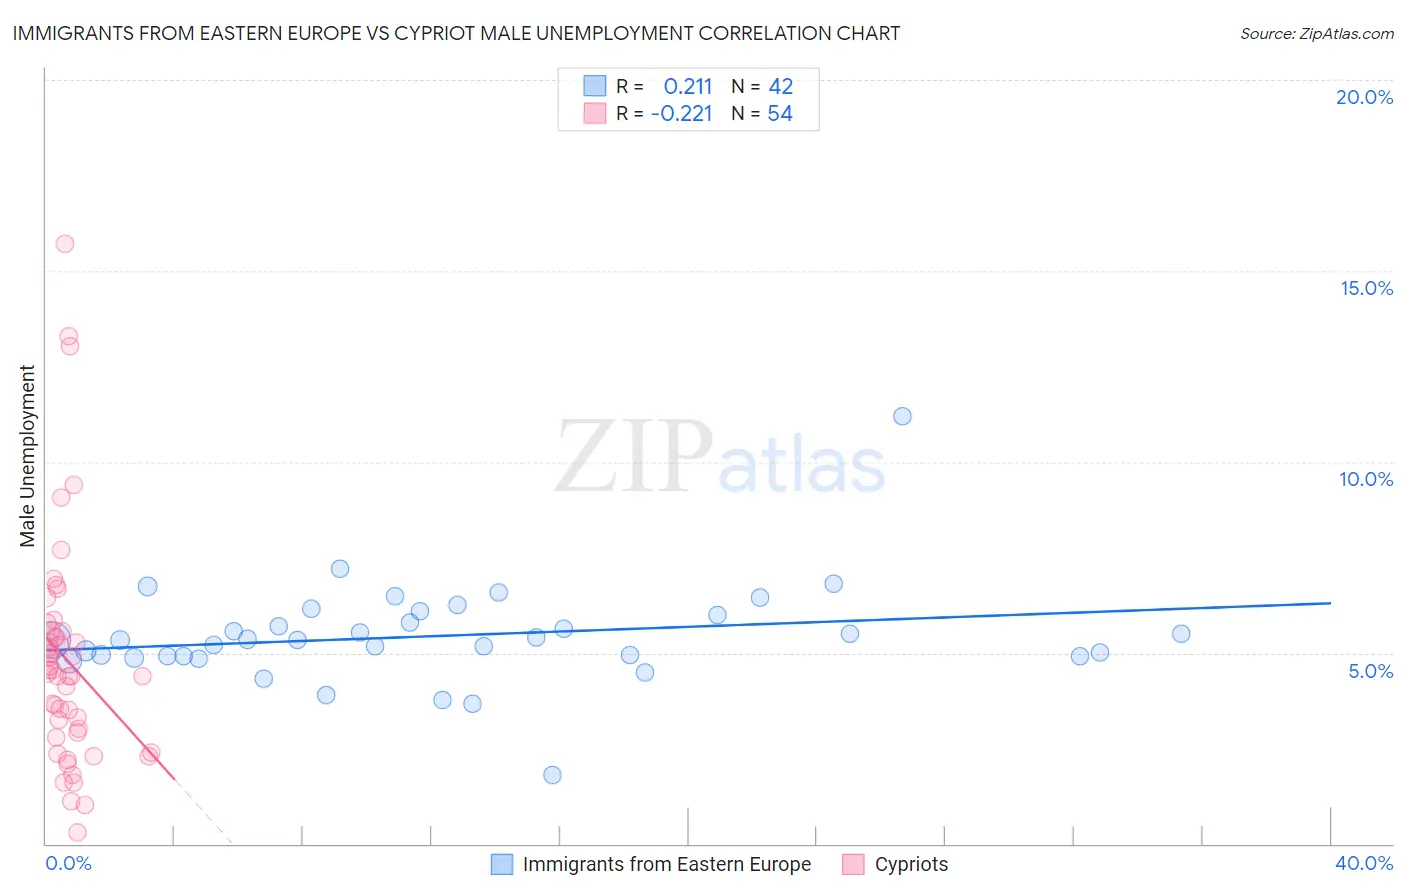
Immigrants from Eastern Europe vs Cypriot Male Unemployment Correlation Chart
The statistical analysis conducted on geographies consisting of 472,485,071 people shows a weak positive correlation between the proportion of Immigrants from Eastern Europe and unemployment rate among males in the United States with a correlation coefficient (R) of 0.211 and weighted average of 5.3%. Similarly, the statistical analysis conducted on geographies consisting of 61,847,118 people shows a weak negative correlation between the proportion of Cypriots and unemployment rate among males in the United States with a correlation coefficient (R) of -0.221 and weighted average of 5.1%, a difference of 2.9%.
Male Unemployment Correlation Summary
| Measurement | Immigrants from Eastern Europe | Cypriot |
| Minimum | 1.8% | 0.30% |
| Maximum | 11.2% | 15.7% |
| Range | 9.4% | 15.4% |
| Mean | 5.4% | 4.8% |
| Median | 5.3% | 4.5% |
| Interquartile 25% (IQ1) | 4.9% | 2.9% |
| Interquartile 75% (IQ3) | 6.0% | 5.6% |
| Interquartile Range (IQR) | 1.1% | 2.7% |
| Standard Deviation (Sample) | 1.3% | 3.0% |
| Standard Deviation (Population) | 1.3% | 2.9% |
Similar Demographics by Male Unemployment
Demographics Similar to Immigrants from Eastern Europe by Male Unemployment
In terms of male unemployment, the demographic groups most similar to Immigrants from Eastern Europe are Peruvian (5.3%, a difference of 0.13%), Immigrants from Kazakhstan (5.3%, a difference of 0.19%), Immigrants from Congo (5.3%, a difference of 0.20%), Immigrants from Russia (5.3%, a difference of 0.20%), and Immigrants from Ireland (5.3%, a difference of 0.22%).
| Demographics | Rating | Rank | Male Unemployment |
| Immigrants | Hong Kong | 65.7 /100 | #163 | Good 5.2% |
| Afghans | 62.0 /100 | #164 | Good 5.3% |
| South Americans | 60.6 /100 | #165 | Good 5.3% |
| Immigrants | Morocco | 60.2 /100 | #166 | Good 5.3% |
| Immigrants | Vietnam | 58.1 /100 | #167 | Average 5.3% |
| Immigrants | Ireland | 57.7 /100 | #168 | Average 5.3% |
| Immigrants | Congo | 57.4 /100 | #169 | Average 5.3% |
| Immigrants | Eastern Europe | 54.1 /100 | #170 | Average 5.3% |
| Peruvians | 51.9 /100 | #171 | Average 5.3% |
| Immigrants | Kazakhstan | 50.8 /100 | #172 | Average 5.3% |
| Immigrants | Russia | 50.7 /100 | #173 | Average 5.3% |
| Immigrants | Iran | 50.0 /100 | #174 | Average 5.3% |
| Immigrants | Iraq | 48.1 /100 | #175 | Average 5.3% |
| Immigrants | Poland | 46.0 /100 | #176 | Average 5.3% |
| Immigrants | Peru | 44.6 /100 | #177 | Average 5.3% |
Demographics Similar to Cypriots by Male Unemployment
In terms of male unemployment, the demographic groups most similar to Cypriots are Estonian (5.1%, a difference of 0.030%), French Canadian (5.1%, a difference of 0.040%), Ukrainian (5.1%, a difference of 0.060%), Mongolian (5.1%, a difference of 0.070%), and Immigrants from Denmark (5.1%, a difference of 0.080%).
| Demographics | Rating | Rank | Male Unemployment |
| Immigrants | Eastern Asia | 90.8 /100 | #111 | Exceptional 5.1% |
| Immigrants | Moldova | 90.3 /100 | #112 | Exceptional 5.1% |
| Immigrants | Austria | 90.3 /100 | #113 | Exceptional 5.1% |
| Romanians | 89.8 /100 | #114 | Excellent 5.1% |
| Immigrants | Asia | 89.6 /100 | #115 | Excellent 5.1% |
| Immigrants | Denmark | 89.4 /100 | #116 | Excellent 5.1% |
| Estonians | 89.0 /100 | #117 | Excellent 5.1% |
| Cypriots | 88.8 /100 | #118 | Excellent 5.1% |
| French Canadians | 88.6 /100 | #119 | Excellent 5.1% |
| Ukrainians | 88.4 /100 | #120 | Excellent 5.1% |
| Mongolians | 88.4 /100 | #121 | Excellent 5.1% |
| Nicaraguans | 88.2 /100 | #122 | Excellent 5.1% |
| Palestinians | 87.7 /100 | #123 | Excellent 5.1% |
| Immigrants | Latvia | 87.5 /100 | #124 | Excellent 5.1% |
| Immigrants | Lithuania | 87.2 /100 | #125 | Excellent 5.1% |