Pakistani vs Cypriot Male Unemployment
COMPARE
Pakistani
Cypriot
Male Unemployment
Male Unemployment Comparison
Pakistanis
Cypriots
5.2%
MALE UNEMPLOYMENT
80.5/ 100
METRIC RATING
134th/ 347
METRIC RANK
5.1%
MALE UNEMPLOYMENT
88.8/ 100
METRIC RATING
118th/ 347
METRIC RANK
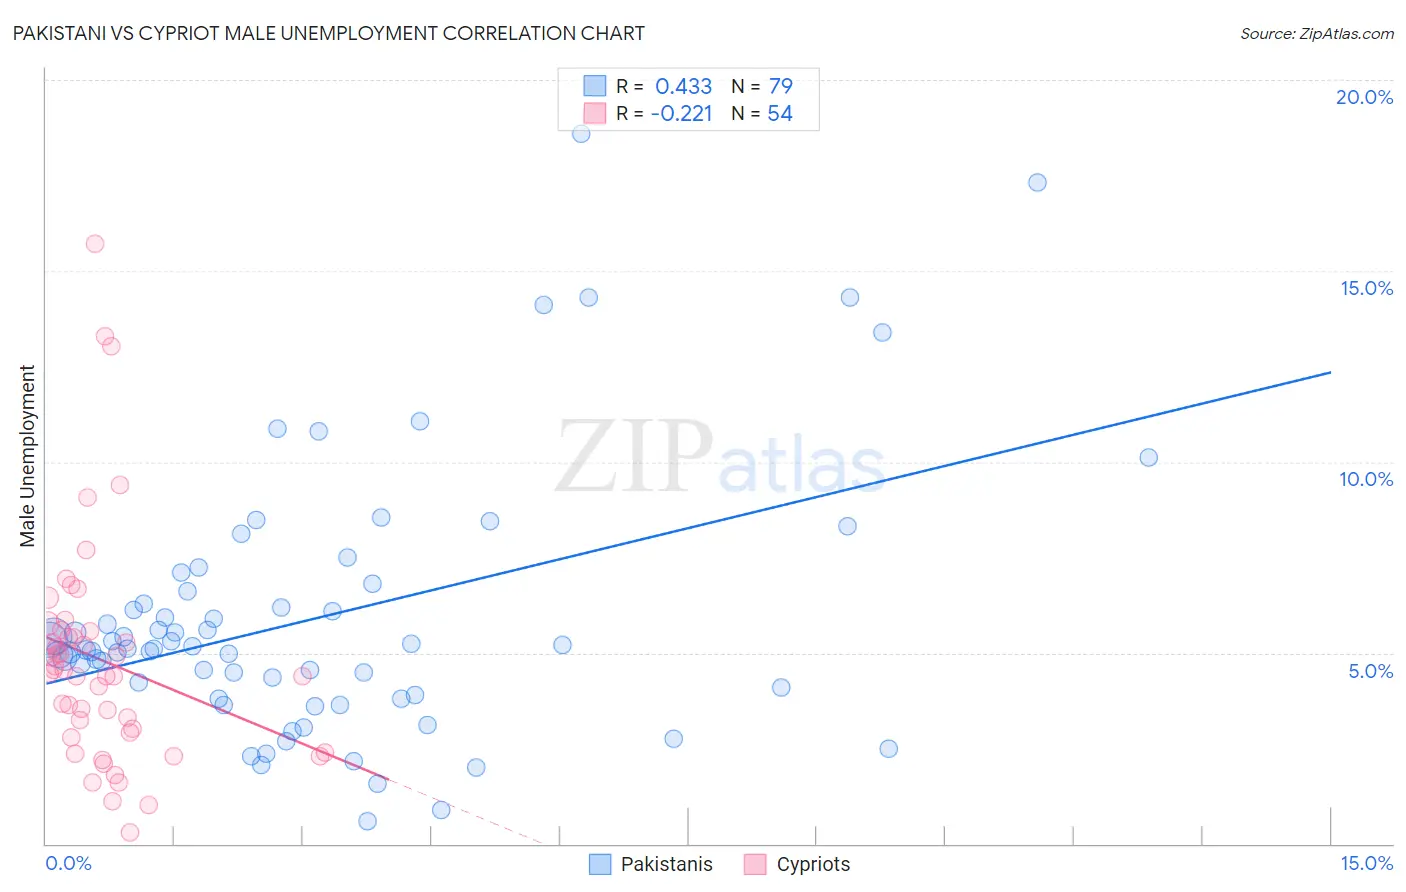
Pakistani vs Cypriot Male Unemployment Correlation Chart
The statistical analysis conducted on geographies consisting of 334,491,221 people shows a moderate positive correlation between the proportion of Pakistanis and unemployment rate among males in the United States with a correlation coefficient (R) of 0.433 and weighted average of 5.2%. Similarly, the statistical analysis conducted on geographies consisting of 61,847,118 people shows a weak negative correlation between the proportion of Cypriots and unemployment rate among males in the United States with a correlation coefficient (R) of -0.221 and weighted average of 5.1%, a difference of 0.99%.
Male Unemployment Correlation Summary
| Measurement | Pakistani | Cypriot |
| Minimum | 0.60% | 0.30% |
| Maximum | 18.6% | 15.7% |
| Range | 18.0% | 15.4% |
| Mean | 5.9% | 4.8% |
| Median | 5.1% | 4.5% |
| Interquartile 25% (IQ1) | 3.9% | 2.9% |
| Interquartile 75% (IQ3) | 6.6% | 5.6% |
| Interquartile Range (IQR) | 2.7% | 2.7% |
| Standard Deviation (Sample) | 3.5% | 3.0% |
| Standard Deviation (Population) | 3.5% | 2.9% |
Demographics Similar to Pakistanis and Cypriots by Male Unemployment
In terms of male unemployment, the demographic groups most similar to Pakistanis are Immigrants from Saudi Arabia (5.2%, a difference of 0.030%), Lebanese (5.2%, a difference of 0.050%), Colombian (5.2%, a difference of 0.060%), Chickasaw (5.2%, a difference of 0.24%), and Immigrants from Germany (5.2%, a difference of 0.26%). Similarly, the demographic groups most similar to Cypriots are Estonian (5.1%, a difference of 0.030%), French Canadian (5.1%, a difference of 0.040%), Ukrainian (5.1%, a difference of 0.060%), Mongolian (5.1%, a difference of 0.070%), and Immigrants from Denmark (5.1%, a difference of 0.080%).
| Demographics | Rating | Rank | Male Unemployment |
| Immigrants | Denmark | 89.4 /100 | #116 | Excellent 5.1% |
| Estonians | 89.0 /100 | #117 | Excellent 5.1% |
| Cypriots | 88.8 /100 | #118 | Excellent 5.1% |
| French Canadians | 88.6 /100 | #119 | Excellent 5.1% |
| Ukrainians | 88.4 /100 | #120 | Excellent 5.1% |
| Mongolians | 88.4 /100 | #121 | Excellent 5.1% |
| Nicaraguans | 88.2 /100 | #122 | Excellent 5.1% |
| Palestinians | 87.7 /100 | #123 | Excellent 5.1% |
| Immigrants | Latvia | 87.5 /100 | #124 | Excellent 5.1% |
| Immigrants | Lithuania | 87.2 /100 | #125 | Excellent 5.1% |
| Immigrants | Colombia | 86.8 /100 | #126 | Excellent 5.1% |
| Immigrants | Brazil | 86.3 /100 | #127 | Excellent 5.2% |
| Hungarians | 85.1 /100 | #128 | Excellent 5.2% |
| Immigrants | Western Europe | 84.8 /100 | #129 | Excellent 5.2% |
| Immigrants | Malaysia | 83.5 /100 | #130 | Excellent 5.2% |
| Immigrants | Germany | 83.0 /100 | #131 | Excellent 5.2% |
| Chickasaw | 82.9 /100 | #132 | Excellent 5.2% |
| Colombians | 81.1 /100 | #133 | Excellent 5.2% |
| Pakistanis | 80.5 /100 | #134 | Excellent 5.2% |
| Immigrants | Saudi Arabia | 80.1 /100 | #135 | Excellent 5.2% |
| Lebanese | 79.9 /100 | #136 | Good 5.2% |