Immigrants from Eastern Europe vs Cypriot Female Poverty
COMPARE
Immigrants from Eastern Europe
Cypriot
Female Poverty
Female Poverty Comparison
Immigrants from Eastern Europe
Cypriots
12.3%
FEMALE POVERTY
97.2/ 100
METRIC RATING
76th/ 347
METRIC RANK
11.8%
FEMALE POVERTY
99.5/ 100
METRIC RATING
33rd/ 347
METRIC RANK
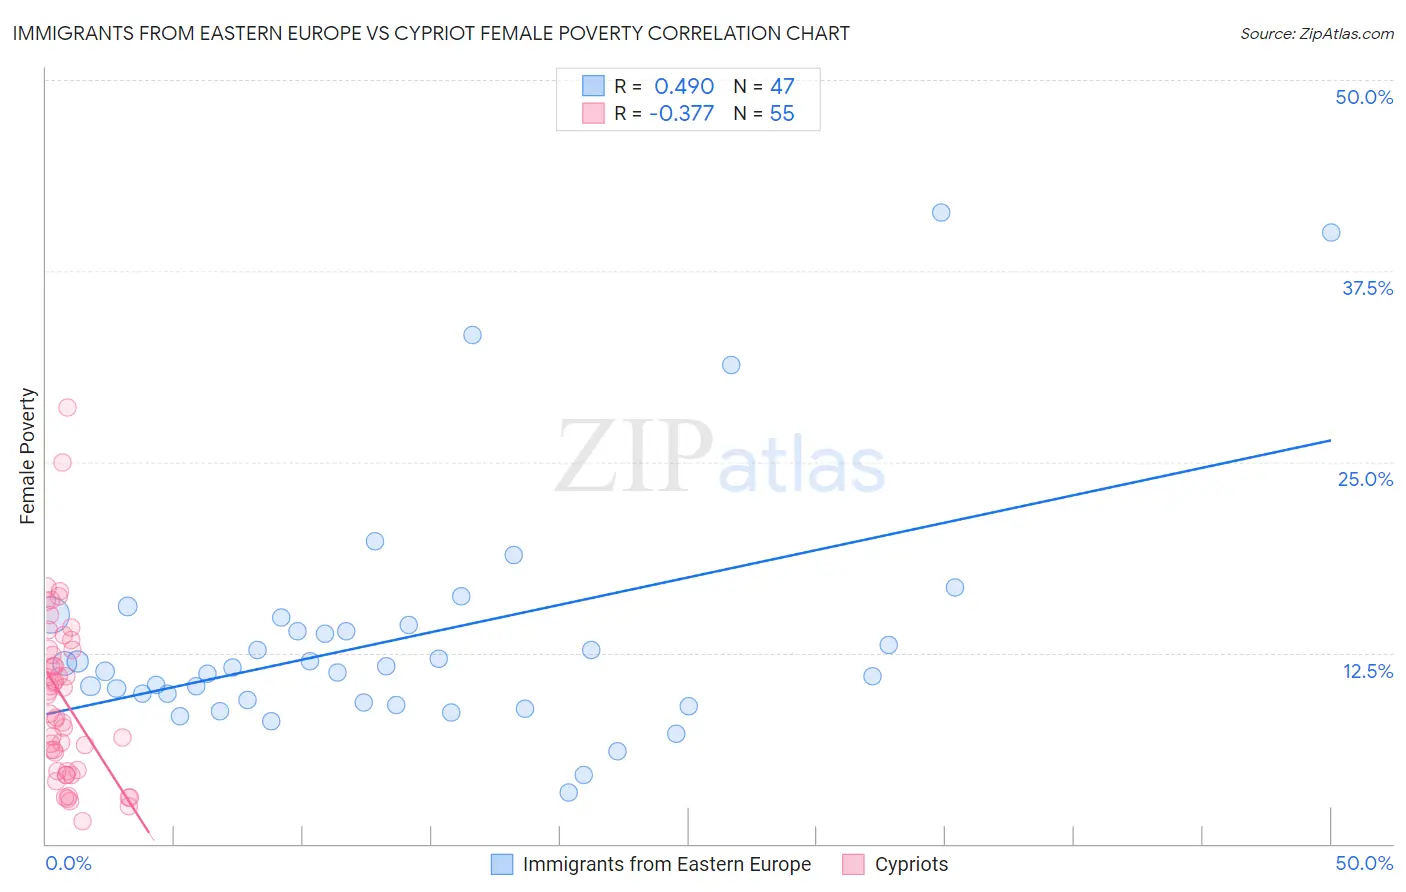
Immigrants from Eastern Europe vs Cypriot Female Poverty Correlation Chart
The statistical analysis conducted on geographies consisting of 475,295,788 people shows a moderate positive correlation between the proportion of Immigrants from Eastern Europe and poverty level among females in the United States with a correlation coefficient (R) of 0.490 and weighted average of 12.3%. Similarly, the statistical analysis conducted on geographies consisting of 61,838,205 people shows a mild negative correlation between the proportion of Cypriots and poverty level among females in the United States with a correlation coefficient (R) of -0.377 and weighted average of 11.8%, a difference of 4.6%.
Female Poverty Correlation Summary
| Measurement | Immigrants from Eastern Europe | Cypriot |
| Minimum | 3.4% | 1.5% |
| Maximum | 41.3% | 28.6% |
| Range | 37.9% | 27.1% |
| Mean | 13.5% | 9.4% |
| Median | 11.6% | 8.5% |
| Interquartile 25% (IQ1) | 9.3% | 4.7% |
| Interquartile 75% (IQ3) | 14.3% | 12.6% |
| Interquartile Range (IQR) | 5.0% | 7.9% |
| Standard Deviation (Sample) | 7.9% | 5.5% |
| Standard Deviation (Population) | 7.8% | 5.4% |
Similar Demographics by Female Poverty
Demographics Similar to Immigrants from Eastern Europe by Female Poverty
In terms of female poverty, the demographic groups most similar to Immigrants from Eastern Europe are Serbian (12.3%, a difference of 0.030%), Egyptian (12.3%, a difference of 0.040%), Immigrants from North America (12.3%, a difference of 0.11%), Slovak (12.3%, a difference of 0.16%), and Immigrants from Sweden (12.3%, a difference of 0.16%).
| Demographics | Rating | Rank | Female Poverty |
| Swiss | 97.7 /100 | #69 | Exceptional 12.2% |
| Immigrants | Belgium | 97.7 /100 | #70 | Exceptional 12.2% |
| Carpatho Rusyns | 97.6 /100 | #71 | Exceptional 12.2% |
| Cambodians | 97.5 /100 | #72 | Exceptional 12.2% |
| Zimbabweans | 97.5 /100 | #73 | Exceptional 12.3% |
| Immigrants | Canada | 97.5 /100 | #74 | Exceptional 12.3% |
| Europeans | 97.4 /100 | #75 | Exceptional 12.3% |
| Immigrants | Eastern Europe | 97.2 /100 | #76 | Exceptional 12.3% |
| Serbians | 97.2 /100 | #77 | Exceptional 12.3% |
| Egyptians | 97.2 /100 | #78 | Exceptional 12.3% |
| Immigrants | North America | 97.1 /100 | #79 | Exceptional 12.3% |
| Slovaks | 97.1 /100 | #80 | Exceptional 12.3% |
| Immigrants | Sweden | 97.1 /100 | #81 | Exceptional 12.3% |
| Jordanians | 97.1 /100 | #82 | Exceptional 12.3% |
| Immigrants | England | 96.9 /100 | #83 | Exceptional 12.3% |
Demographics Similar to Cypriots by Female Poverty
In terms of female poverty, the demographic groups most similar to Cypriots are Danish (11.7%, a difference of 0.070%), Immigrants from Singapore (11.8%, a difference of 0.12%), Polish (11.7%, a difference of 0.21%), Immigrants from Iran (11.8%, a difference of 0.29%), and Greek (11.7%, a difference of 0.42%).
| Demographics | Rating | Rank | Female Poverty |
| Croatians | 99.6 /100 | #26 | Exceptional 11.6% |
| Iranians | 99.6 /100 | #27 | Exceptional 11.7% |
| Immigrants | Korea | 99.6 /100 | #28 | Exceptional 11.7% |
| Immigrants | North Macedonia | 99.6 /100 | #29 | Exceptional 11.7% |
| Greeks | 99.5 /100 | #30 | Exceptional 11.7% |
| Poles | 99.5 /100 | #31 | Exceptional 11.7% |
| Danes | 99.5 /100 | #32 | Exceptional 11.7% |
| Cypriots | 99.5 /100 | #33 | Exceptional 11.8% |
| Immigrants | Singapore | 99.4 /100 | #34 | Exceptional 11.8% |
| Immigrants | Iran | 99.4 /100 | #35 | Exceptional 11.8% |
| Immigrants | Pakistan | 99.4 /100 | #36 | Exceptional 11.8% |
| Immigrants | Greece | 99.3 /100 | #37 | Exceptional 11.8% |
| Russians | 99.3 /100 | #38 | Exceptional 11.8% |
| Immigrants | Poland | 99.3 /100 | #39 | Exceptional 11.8% |
| Macedonians | 99.3 /100 | #40 | Exceptional 11.8% |