Immigrants from Cameroon vs Crow Unemployment Among Women with Children Ages 6 to 17 years
COMPARE
Immigrants from Cameroon
Crow
Unemployment Among Women with Children Ages 6 to 17 years
Unemployment Among Women with Children Ages 6 to 17 years Comparison
Immigrants from Cameroon
Crow
9.4%
UNEMPLOYMENT AMONG WOMEN WITH CHILDREN AGES 6 TO 17 YEARS
1.8/ 100
METRIC RATING
245th/ 347
METRIC RANK
9.2%
UNEMPLOYMENT AMONG WOMEN WITH CHILDREN AGES 6 TO 17 YEARS
5.8/ 100
METRIC RATING
221st/ 347
METRIC RANK
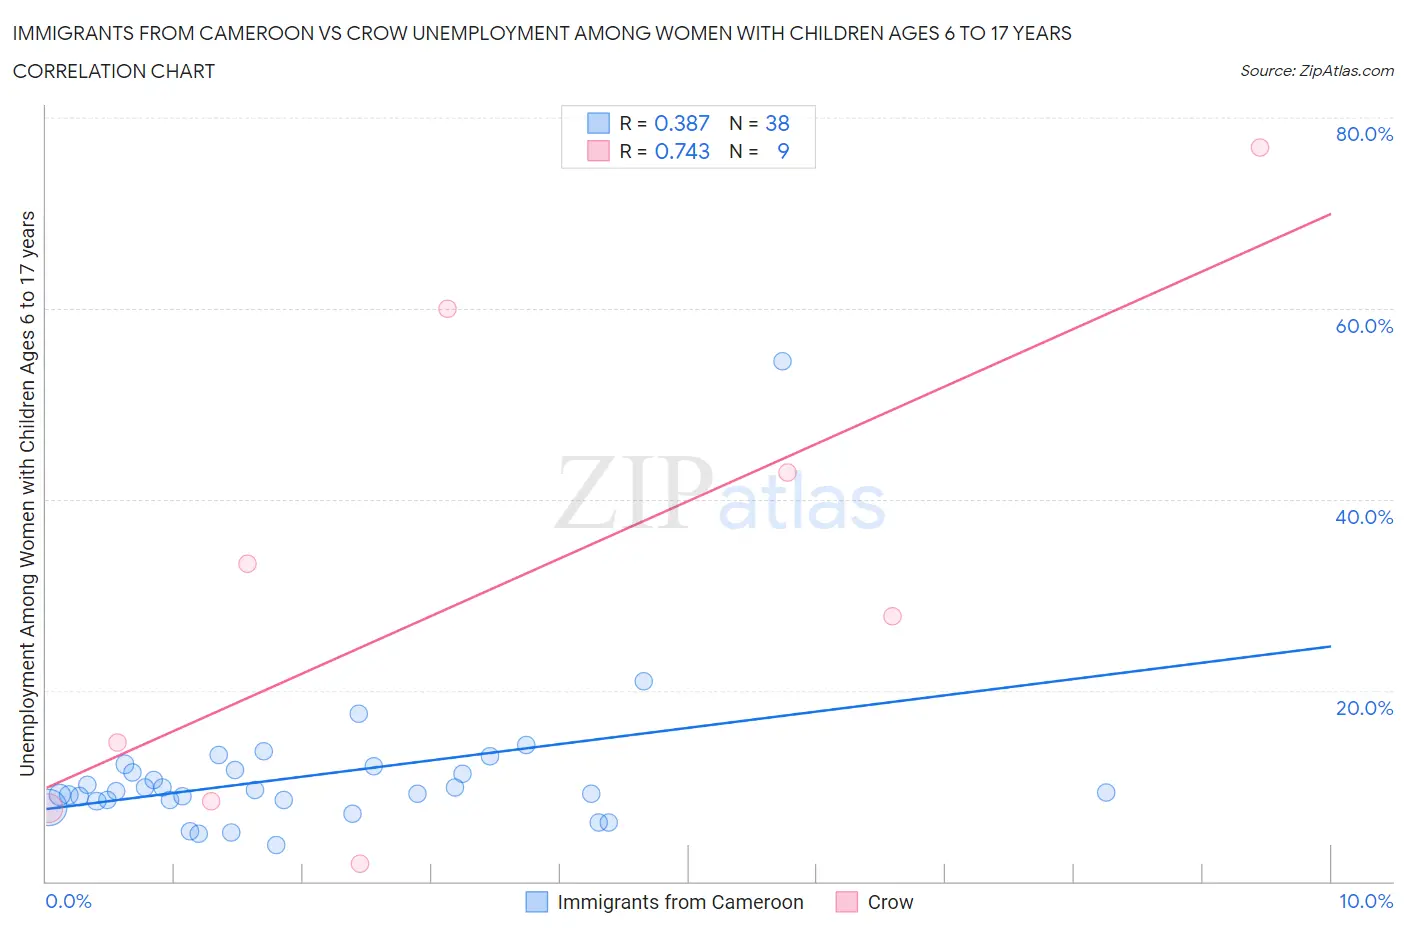
Immigrants from Cameroon vs Crow Unemployment Among Women with Children Ages 6 to 17 years Correlation Chart
The statistical analysis conducted on geographies consisting of 114,317,361 people shows a mild positive correlation between the proportion of Immigrants from Cameroon and unemployment rate among women with children between the ages 6 and 17 in the United States with a correlation coefficient (R) of 0.387 and weighted average of 9.4%. Similarly, the statistical analysis conducted on geographies consisting of 53,126,495 people shows a strong positive correlation between the proportion of Crow and unemployment rate among women with children between the ages 6 and 17 in the United States with a correlation coefficient (R) of 0.743 and weighted average of 9.2%, a difference of 1.3%.
Unemployment Among Women with Children Ages 6 to 17 years Correlation Summary
| Measurement | Immigrants from Cameroon | Crow |
| Minimum | 3.8% | 1.8% |
| Maximum | 54.5% | 76.9% |
| Range | 50.7% | 75.1% |
| Mean | 11.0% | 30.3% |
| Median | 9.4% | 27.8% |
| Interquartile 25% (IQ1) | 8.5% | 8.0% |
| Interquartile 75% (IQ3) | 11.6% | 51.4% |
| Interquartile Range (IQR) | 3.1% | 43.4% |
| Standard Deviation (Sample) | 8.0% | 25.7% |
| Standard Deviation (Population) | 7.9% | 24.2% |
Similar Demographics by Unemployment Among Women with Children Ages 6 to 17 years
Demographics Similar to Immigrants from Cameroon by Unemployment Among Women with Children Ages 6 to 17 years
In terms of unemployment among women with children ages 6 to 17 years, the demographic groups most similar to Immigrants from Cameroon are English (9.4%, a difference of 0.030%), Scottish (9.4%, a difference of 0.080%), Immigrants from Colombia (9.3%, a difference of 0.17%), Immigrants from Africa (9.4%, a difference of 0.17%), and Colombian (9.3%, a difference of 0.19%).
| Demographics | Rating | Rank | Unemployment Among Women with Children Ages 6 to 17 years |
| Arabs | 2.7 /100 | #238 | Tragic 9.3% |
| Immigrants | Saudi Arabia | 2.7 /100 | #239 | Tragic 9.3% |
| Guatemalans | 2.3 /100 | #240 | Tragic 9.3% |
| Colombians | 2.2 /100 | #241 | Tragic 9.3% |
| Immigrants | Colombia | 2.1 /100 | #242 | Tragic 9.3% |
| Scottish | 2.0 /100 | #243 | Tragic 9.4% |
| English | 1.9 /100 | #244 | Tragic 9.4% |
| Immigrants | Cameroon | 1.8 /100 | #245 | Tragic 9.4% |
| Immigrants | Africa | 1.6 /100 | #246 | Tragic 9.4% |
| Poles | 1.5 /100 | #247 | Tragic 9.4% |
| Dutch | 1.5 /100 | #248 | Tragic 9.4% |
| Immigrants | South America | 1.5 /100 | #249 | Tragic 9.4% |
| Immigrants | Guatemala | 1.3 /100 | #250 | Tragic 9.4% |
| Central Americans | 1.3 /100 | #251 | Tragic 9.4% |
| Creek | 1.2 /100 | #252 | Tragic 9.4% |
Demographics Similar to Crow by Unemployment Among Women with Children Ages 6 to 17 years
In terms of unemployment among women with children ages 6 to 17 years, the demographic groups most similar to Crow are Immigrants from Southern Europe (9.2%, a difference of 0.010%), Immigrants from Eritrea (9.2%, a difference of 0.010%), Belgian (9.2%, a difference of 0.11%), Immigrants from El Salvador (9.3%, a difference of 0.12%), and Chinese (9.3%, a difference of 0.13%).
| Demographics | Rating | Rank | Unemployment Among Women with Children Ages 6 to 17 years |
| Iroquois | 7.5 /100 | #214 | Tragic 9.2% |
| Immigrants | Germany | 7.2 /100 | #215 | Tragic 9.2% |
| Immigrants | Uruguay | 7.2 /100 | #216 | Tragic 9.2% |
| Germans | 7.2 /100 | #217 | Tragic 9.2% |
| Syrians | 6.9 /100 | #218 | Tragic 9.2% |
| Immigrants | Scotland | 6.6 /100 | #219 | Tragic 9.2% |
| Belgians | 6.4 /100 | #220 | Tragic 9.2% |
| Crow | 5.8 /100 | #221 | Tragic 9.2% |
| Immigrants | Southern Europe | 5.8 /100 | #222 | Tragic 9.2% |
| Immigrants | Eritrea | 5.8 /100 | #223 | Tragic 9.2% |
| Immigrants | El Salvador | 5.3 /100 | #224 | Tragic 9.3% |
| Chinese | 5.2 /100 | #225 | Tragic 9.3% |
| Immigrants | Azores | 4.6 /100 | #226 | Tragic 9.3% |
| Panamanians | 4.5 /100 | #227 | Tragic 9.3% |
| Estonians | 4.4 /100 | #228 | Tragic 9.3% |