Immigrants from Brazil vs Crow Unemployment Among Women with Children Ages 6 to 17 years
COMPARE
Immigrants from Brazil
Crow
Unemployment Among Women with Children Ages 6 to 17 years
Unemployment Among Women with Children Ages 6 to 17 years Comparison
Immigrants from Brazil
Crow
9.0%
UNEMPLOYMENT AMONG WOMEN WITH CHILDREN AGES 6 TO 17 YEARS
51.0/ 100
METRIC RATING
173rd/ 347
METRIC RANK
9.2%
UNEMPLOYMENT AMONG WOMEN WITH CHILDREN AGES 6 TO 17 YEARS
5.8/ 100
METRIC RATING
221st/ 347
METRIC RANK
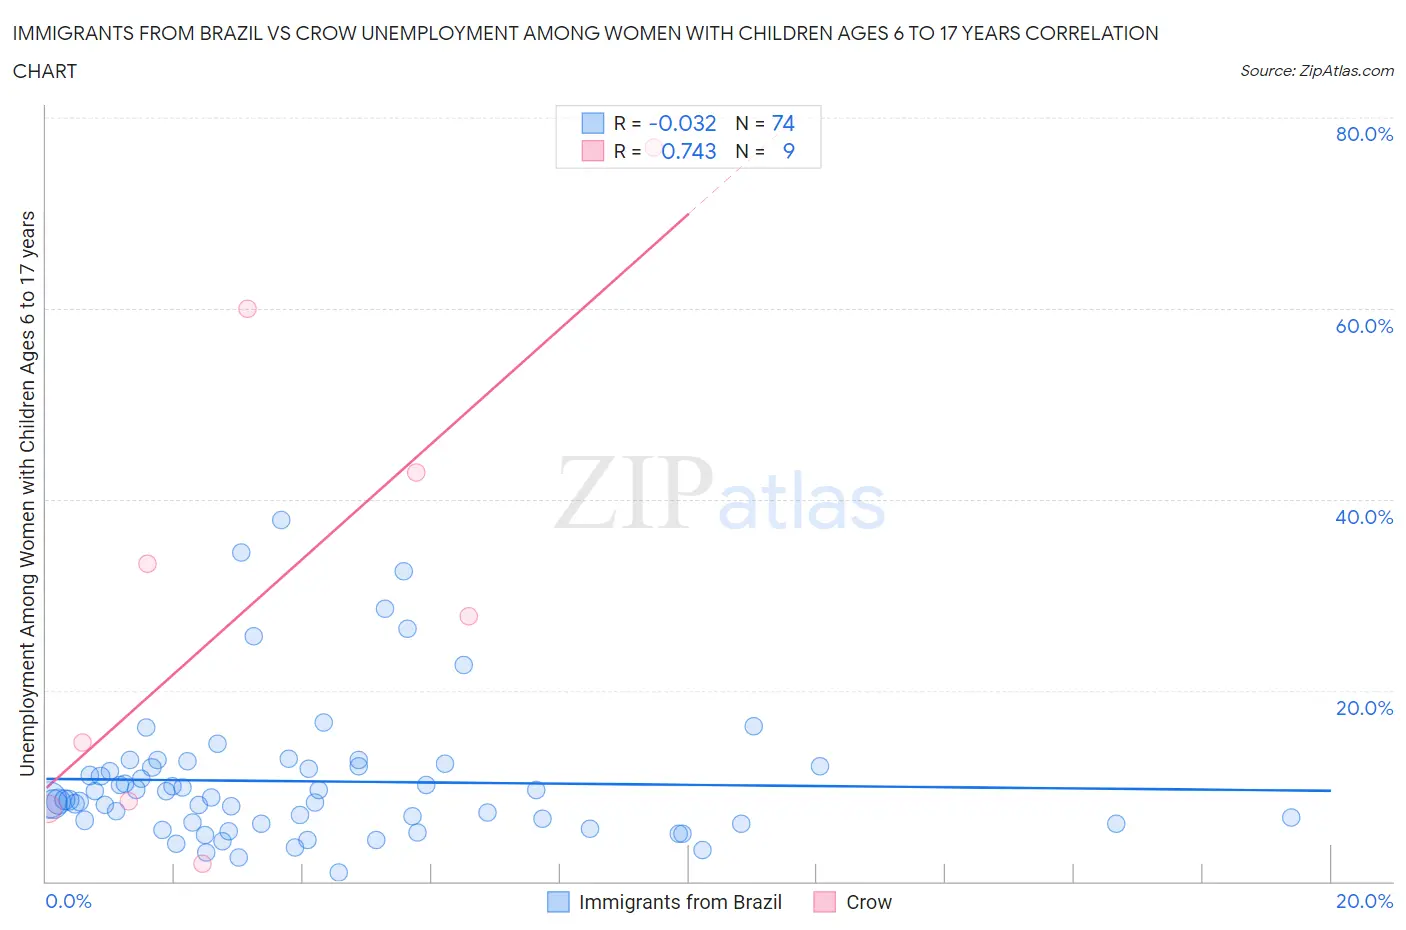
Immigrants from Brazil vs Crow Unemployment Among Women with Children Ages 6 to 17 years Correlation Chart
The statistical analysis conducted on geographies consisting of 251,390,083 people shows no correlation between the proportion of Immigrants from Brazil and unemployment rate among women with children between the ages 6 and 17 in the United States with a correlation coefficient (R) of -0.032 and weighted average of 9.0%. Similarly, the statistical analysis conducted on geographies consisting of 53,126,495 people shows a strong positive correlation between the proportion of Crow and unemployment rate among women with children between the ages 6 and 17 in the United States with a correlation coefficient (R) of 0.743 and weighted average of 9.2%, a difference of 3.1%.
Unemployment Among Women with Children Ages 6 to 17 years Correlation Summary
| Measurement | Immigrants from Brazil | Crow |
| Minimum | 0.90% | 1.8% |
| Maximum | 37.9% | 76.9% |
| Range | 37.0% | 75.1% |
| Mean | 10.5% | 30.3% |
| Median | 8.5% | 27.8% |
| Interquartile 25% (IQ1) | 6.1% | 8.0% |
| Interquartile 75% (IQ3) | 12.0% | 51.4% |
| Interquartile Range (IQR) | 5.9% | 43.4% |
| Standard Deviation (Sample) | 7.2% | 25.7% |
| Standard Deviation (Population) | 7.2% | 24.2% |
Similar Demographics by Unemployment Among Women with Children Ages 6 to 17 years
Demographics Similar to Immigrants from Brazil by Unemployment Among Women with Children Ages 6 to 17 years
In terms of unemployment among women with children ages 6 to 17 years, the demographic groups most similar to Immigrants from Brazil are Jordanian (9.0%, a difference of 0.050%), Immigrants from West Indies (9.0%, a difference of 0.050%), Immigrants from Costa Rica (9.0%, a difference of 0.050%), Turkish (8.9%, a difference of 0.14%), and British (8.9%, a difference of 0.19%).
| Demographics | Rating | Rank | Unemployment Among Women with Children Ages 6 to 17 years |
| Moroccans | 58.3 /100 | #166 | Average 8.9% |
| Immigrants | England | 57.7 /100 | #167 | Average 8.9% |
| Immigrants | Croatia | 57.1 /100 | #168 | Average 8.9% |
| British | 55.2 /100 | #169 | Average 8.9% |
| Turks | 54.1 /100 | #170 | Average 8.9% |
| Jordanians | 52.2 /100 | #171 | Average 9.0% |
| Immigrants | West Indies | 52.2 /100 | #172 | Average 9.0% |
| Immigrants | Brazil | 51.0 /100 | #173 | Average 9.0% |
| Immigrants | Costa Rica | 50.0 /100 | #174 | Average 9.0% |
| Immigrants | Sierra Leone | 45.9 /100 | #175 | Average 9.0% |
| Immigrants | Italy | 43.7 /100 | #176 | Average 9.0% |
| Immigrants | Jordan | 41.6 /100 | #177 | Average 9.0% |
| Menominee | 39.3 /100 | #178 | Fair 9.0% |
| Immigrants | Zaire | 38.3 /100 | #179 | Fair 9.0% |
| Ethiopians | 37.6 /100 | #180 | Fair 9.0% |
Demographics Similar to Crow by Unemployment Among Women with Children Ages 6 to 17 years
In terms of unemployment among women with children ages 6 to 17 years, the demographic groups most similar to Crow are Immigrants from Southern Europe (9.2%, a difference of 0.010%), Immigrants from Eritrea (9.2%, a difference of 0.010%), Belgian (9.2%, a difference of 0.11%), Immigrants from El Salvador (9.3%, a difference of 0.12%), and Chinese (9.3%, a difference of 0.13%).
| Demographics | Rating | Rank | Unemployment Among Women with Children Ages 6 to 17 years |
| Iroquois | 7.5 /100 | #214 | Tragic 9.2% |
| Immigrants | Germany | 7.2 /100 | #215 | Tragic 9.2% |
| Immigrants | Uruguay | 7.2 /100 | #216 | Tragic 9.2% |
| Germans | 7.2 /100 | #217 | Tragic 9.2% |
| Syrians | 6.9 /100 | #218 | Tragic 9.2% |
| Immigrants | Scotland | 6.6 /100 | #219 | Tragic 9.2% |
| Belgians | 6.4 /100 | #220 | Tragic 9.2% |
| Crow | 5.8 /100 | #221 | Tragic 9.2% |
| Immigrants | Southern Europe | 5.8 /100 | #222 | Tragic 9.2% |
| Immigrants | Eritrea | 5.8 /100 | #223 | Tragic 9.2% |
| Immigrants | El Salvador | 5.3 /100 | #224 | Tragic 9.3% |
| Chinese | 5.2 /100 | #225 | Tragic 9.3% |
| Immigrants | Azores | 4.6 /100 | #226 | Tragic 9.3% |
| Panamanians | 4.5 /100 | #227 | Tragic 9.3% |
| Estonians | 4.4 /100 | #228 | Tragic 9.3% |