Immigrants from Bolivia vs Soviet Union Unemployment Among Women with Children Ages 6 to 17 years

COMPARE

Immigrants from Bolivia
Race
Ancestry
AfghanAfricanAlaska NativeAlaskan AthabascanAlbanianAleutAlsatianAmericanApacheArabArapahoArgentineanArmenianAssyrian/Chaldean/SyriacAustralianAustrianBahamianBangladeshiBarbadianBasqueBelgianBelizeanBermudanBhutaneseBlackfeetBolivianBrazilianBritishBritish West IndianBulgarianBurmeseCajunCambodianCanadianCape VerdeanCarpatho RusynCelticCentral AmericanCentral American IndianCherokeeCheyenneChickasawChileanChineseChippewaChoctawColombianColvilleComancheCosta RicanCreeCreekCroatianCrowCubanCypriotCzechCzechoslovakianDanishDelawareDominicanDutchDutch West IndianEastern EuropeanEcuadorianEgyptianEnglishEstonianEthiopianEuropeanFijianFilipinoFinnishFrenchFrench American IndianFrench CanadianGermanGerman RussianGhanaianGreekGuamanian/ChamorroGuatemalanGuyaneseHaitianHmongHonduranHopiHoumaHungarianIcelanderIndian (Asian)IndonesianInupiatIranianIraqiIrishIroquoisIsraeliItalianJamaicanJapaneseJordanianKenyanKiowaKoreanLaotianLatvianLebaneseLiberianLithuanianLumbeeLuxembourgerMacedonianMalaysianMalteseMarshalleseMenomineeMexicanMexican American IndianMongolianMoroccanNative HawaiianNavajoNepaleseNew ZealanderNicaraguanNigerianNorthern EuropeanNorwegianOkinawanOsageOttawaPaiutePakistaniPalestinianPanamanianParaguayanPennsylvania GermanPeruvianPimaPolishPortuguesePotawatomiPuebloPuerto RicanPuget Sound SalishRomanianRussianSalvadoranSamoanScandinavianScotch-IrishScottishSeminoleSenegaleseSerbianShoshoneSierra LeoneanSiouxSlavicSlovakSloveneSomaliSouth AfricanSouth AmericanSouth American IndianSpaniardSpanishSpanish AmericanSpanish American IndianSri LankanSubsaharan AfricanSudaneseSwedishSwissSyrianTaiwaneseThaiTlingit-HaidaTohono O'OdhamTonganTrinidadian and TobagonianTsimshianTurkishU.S. Virgin IslanderUgandanUkrainianUruguayanUteVenezuelanVietnameseWelshWest IndianYakamaYaquiYugoslavianYumanYup'ikZimbabwean
Immigration
NonimmigrantsImmigrantsAfghanistanAfricaAlbaniaArgentinaArmeniaAsiaAustraliaAustriaBahamasBangladeshBarbadosBelarusBelgiumBelizeBoliviaBosnia and HerzegovinaBrazilBulgariaBurma/MyanmarCabo VerdeCambodiaCameroonCanadaCaribbeanCentral AmericaChileChinaColombiaCongoCosta RicaCroatiaCubaCzechoslovakiaDenmarkDominicaDominican RepublicEastern AfricaEastern AsiaEastern EuropeEcuadorEgyptEl SalvadorEnglandEritreaEthiopiaEuropeFijiFranceGermanyGhanaGreeceGrenadaGuatemalaGuyanaHaitiHondurasHong KongHungaryIndiaIndonesiaIranIraqIrelandIsraelItalyJamaicaJapanJordanKazakhstanKenyaKoreaKuwaitLaosLatin AmericaLatviaLebanonLiberiaLithuaniaMalaysiaMexicoMicronesiaMiddle AfricaMoldovaMoroccoNepalNetherlandsNicaraguaNigeriaNorth AmericaNorth MacedoniaNorthern AfricaNorthern EuropeNorwayOceaniaPakistanPanamaPeruPhilippinesPolandPortugalRomaniaRussiaSaudi ArabiaScotlandSenegalSerbiaSierra LeoneSingaporeSomaliaSouth AfricaSouth AmericaSouth Central AsiaSouth Eastern AsiaSouthern EuropeSpainSri LankaSt. Vincent and the GrenadinesSudanSwedenSwitzerlandSyriaTaiwanThailandTrinidad and TobagoTurkeyUgandaUkraineUruguayUzbekistanVenezuelaVietnamWest IndiesWestern AfricaWestern AsiaWestern EuropeYemenZaireZimbabweAzores
Soviet Union
Race
Ancestry
AfghanAfricanAlaska NativeAlaskan AthabascanAlbanianAleutAlsatianAmericanApacheArabArapahoArgentineanArmenianAssyrian/Chaldean/SyriacAustralianAustrianBahamianBangladeshiBarbadianBasqueBelgianBelizeanBermudanBhutaneseBlackfeetBolivianBrazilianBritishBritish West IndianBulgarianBurmeseCajunCambodianCanadianCape VerdeanCarpatho RusynCelticCentral AmericanCentral American IndianCherokeeCheyenneChickasawChileanChineseChippewaChoctawColombianColvilleComancheCosta RicanCreeCreekCroatianCrowCubanCypriotCzechCzechoslovakianDanishDelawareDominicanDutchDutch West IndianEastern EuropeanEcuadorianEgyptianEnglishEstonianEthiopianEuropeanFijianFilipinoFinnishFrenchFrench American IndianFrench CanadianGermanGerman RussianGhanaianGreekGuamanian/ChamorroGuatemalanGuyaneseHaitianHmongHonduranHopiHoumaHungarianIcelanderIndian (Asian)IndonesianInupiatIranianIraqiIrishIroquoisIsraeliItalianJamaicanJapaneseJordanianKenyanKiowaKoreanLaotianLatvianLebaneseLiberianLithuanianLumbeeLuxembourgerMacedonianMalaysianMalteseMarshalleseMenomineeMexicanMexican American IndianMongolianMoroccanNative HawaiianNavajoNepaleseNew ZealanderNicaraguanNigerianNorthern EuropeanNorwegianOkinawanOsageOttawaPaiutePakistaniPalestinianPanamanianParaguayanPennsylvania GermanPeruvianPimaPolishPortuguesePotawatomiPuebloPuerto RicanPuget Sound SalishRomanianRussianSalvadoranSamoanScandinavianScotch-IrishScottishSeminoleSenegaleseSerbianShoshoneSierra LeoneanSiouxSlavicSlovakSloveneSomaliSouth AfricanSouth AmericanSouth American IndianSoviet UnionSpaniardSpanishSpanish AmericanSpanish American IndianSri LankanSubsaharan AfricanSudaneseSwedishSwissSyrianTaiwaneseThaiTlingit-HaidaTohono O'OdhamTonganTrinidadian and TobagonianTsimshianTurkishU.S. Virgin IslanderUgandanUkrainianUruguayanUteVenezuelanVietnameseWelshWest IndianYakamaYaquiYugoslavianYumanYup'ikZimbabwean
Immigration
NonimmigrantsImmigrantsAfghanistanAfricaAlbaniaArgentinaArmeniaAsiaAustraliaAustriaBahamasBangladeshBarbadosBelarusBelgiumBelizeBosnia and HerzegovinaBrazilBulgariaBurma/MyanmarCabo VerdeCambodiaCameroonCanadaCaribbeanCentral AmericaChileChinaColombiaCongoCosta RicaCroatiaCubaCzechoslovakiaDenmarkDominicaDominican RepublicEastern AfricaEastern AsiaEastern EuropeEcuadorEgyptEl SalvadorEnglandEritreaEthiopiaEuropeFijiFranceGermanyGhanaGreeceGrenadaGuatemalaGuyanaHaitiHondurasHong KongHungaryIndiaIndonesiaIranIraqIrelandIsraelItalyJamaicaJapanJordanKazakhstanKenyaKoreaKuwaitLaosLatin AmericaLatviaLebanonLiberiaLithuaniaMalaysiaMexicoMicronesiaMiddle AfricaMoldovaMoroccoNepalNetherlandsNicaraguaNigeriaNorth AmericaNorth MacedoniaNorthern AfricaNorthern EuropeNorwayOceaniaPakistanPanamaPeruPhilippinesPolandPortugalRomaniaRussiaSaudi ArabiaScotlandSenegalSerbiaSierra LeoneSingaporeSomaliaSouth AfricaSouth AmericaSouth Central AsiaSouth Eastern AsiaSouthern EuropeSpainSri LankaSt. Vincent and the GrenadinesSudanSwedenSwitzerlandSyriaTaiwanThailandTrinidad and TobagoTurkeyUgandaUkraineUruguayUzbekistanVenezuelaVietnamWest IndiesWestern AfricaWestern AsiaWestern EuropeYemenZaireZimbabweAzores
Unemployment Among Women with Children Ages 6 to 17 years
Income
Poverty
Unemployment
Labor Participation
Family Structure
Vehicle Availability
Education Level
Disability

Unemployment Among Women with Children Ages 6 to 17 years Comparison

Immigrants from Bolivia

Soviet Union

Exceptional
Exceptional
8.4%
UNEMPLOYMENT AMONG WOMEN WITH CHILDREN AGES 6 TO 17 YEARS
99.6/ 100
METRIC RATING
81st/ 347
METRIC RANK
7.1%
UNEMPLOYMENT AMONG WOMEN WITH CHILDREN AGES 6 TO 17 YEARS
100.0/ 100
METRIC RATING
7th/ 347
METRIC RANK

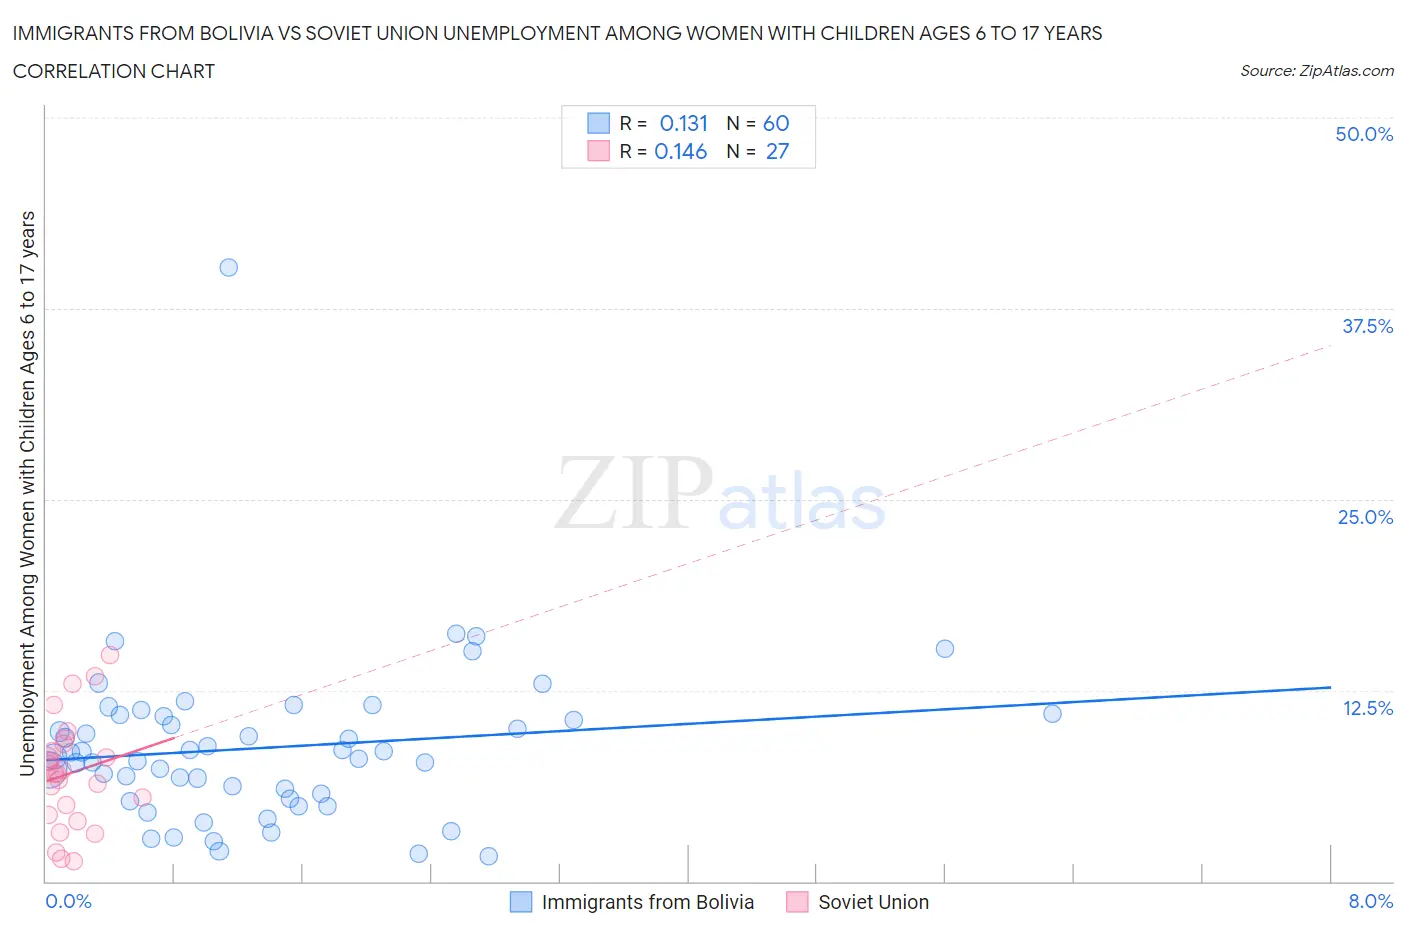
Immigrants from Bolivia vs Soviet Union Unemployment Among Women with Children Ages 6 to 17 years Correlation Chart

The statistical analysis conducted on geographies consisting of 133,267,206 people shows a poor positive correlation between the proportion of Immigrants from Bolivia and unemployment rate among women with children between the ages 6 and 17 in the United States with a correlation coefficient (R) of 0.131 and weighted average of 8.4%. Similarly, the statistical analysis conducted on geographies consisting of 40,907,695 people shows a poor positive correlation between the proportion of Soviet Union and unemployment rate among women with children between the ages 6 and 17 in the United States with a correlation coefficient (R) of 0.146 and weighted average of 7.1%, a difference of 18.9%.
Immigrants from Bolivia vs Soviet Union Unemployment Among Women with Children Ages 6 to 17 years

Unemployment Among Women with Children Ages 6 to 17 years Correlation Summary

MeasurementImmigrants from BoliviaSoviet Union
Minimum1.6%1.3%
Maximum40.2%14.8%
Range38.6%13.5%
Mean8.7%7.1%
Median8.3%7.0%
Interquartile 25% (IQ1)5.6%4.3%
Interquartile 75% (IQ3)10.8%9.0%
Interquartile Range (IQR)5.3%4.7%
Standard Deviation (Sample)5.5%3.5%
Standard Deviation (Population)5.5%3.5%

Similar Demographics by Unemployment Among Women with Children Ages 6 to 17 years

Demographics Similar to Immigrants from Bolivia by Unemployment Among Women with Children Ages 6 to 17 years

In terms of unemployment among women with children ages 6 to 17 years, the demographic groups most similar to Immigrants from Bolivia are Cypriot (8.4%, a difference of 0.020%), Immigrants from Belarus (8.4%, a difference of 0.12%), Mongolian (8.4%, a difference of 0.16%), Pakistani (8.4%, a difference of 0.17%), and Bulgarian (8.4%, a difference of 0.19%).
DemographicsRating | RankUnemployment Among Women with Children Ages 6 to 17 years
Samoans
99.7
/100
|
#74
Exceptional
8.4%
Immigrants | Sri Lanka
99.7
/100
|
#75
Exceptional
8.4%
Immigrants | Moldova
99.7
/100
|
#76
Exceptional
8.4%
Iraqis
99.7
/100
|
#77
Exceptional
8.4%
Pakistanis
99.6
/100
|
#78
Exceptional
8.4%
Mongolians
99.6
/100
|
#79
Exceptional
8.4%
Immigrants | Belarus
99.6
/100
|
#80
Exceptional
8.4%
Immigrants | Bolivia
99.6
/100
|
#81
Exceptional
8.4%
Cypriots
99.6
/100
|
#82
Exceptional
8.4%
Bulgarians
99.5
/100
|
#83
Exceptional
8.4%
Japanese
99.5
/100
|
#84
Exceptional
8.4%
Immigrants | North Macedonia
99.4
/100
|
#85
Exceptional
8.5%
Alaskan Athabascans
99.4
/100
|
#86
Exceptional
8.5%
Immigrants | Israel
99.1
/100
|
#87
Exceptional
8.5%
Immigrants | Vietnam
99.1
/100
|
#88
Exceptional
8.5%

Demographics Similar to Soviet Union by Unemployment Among Women with Children Ages 6 to 17 years

In terms of unemployment among women with children ages 6 to 17 years, the demographic groups most similar to Soviet Union are Tlingit-Haida (7.1%, a difference of 0.060%), Okinawan (7.0%, a difference of 0.53%), Ute (7.0%, a difference of 1.1%), Immigrants from Hong Kong (7.2%, a difference of 1.4%), and Assyrian/Chaldean/Syriac (7.2%, a difference of 1.7%).
DemographicsRating | RankUnemployment Among Women with Children Ages 6 to 17 years
Taiwanese
100.0
/100
|
#1
Exceptional
6.5%
Fijians
100.0
/100
|
#2
Exceptional
6.6%
Tongans
100.0
/100
|
#3
Exceptional
6.7%
Ute
100.0
/100
|
#4
Exceptional
7.0%
Okinawans
100.0
/100
|
#5
Exceptional
7.0%
Tlingit-Haida
100.0
/100
|
#6
Exceptional
7.1%
Soviet Union
100.0
/100
|
#7
Exceptional
7.1%
Immigrants | Hong Kong
100.0
/100
|
#8
Exceptional
7.2%
Assyrians/Chaldeans/Syriacs
100.0
/100
|
#9
Exceptional
7.2%
Immigrants | Fiji
100.0
/100
|
#10
Exceptional
7.3%
Immigrants | Taiwan
100.0
/100
|
#11
Exceptional
7.3%
Bangladeshis
100.0
/100
|
#12
Exceptional
7.4%
Indonesians
100.0
/100
|
#13
Exceptional
7.4%
Sudanese
100.0
/100
|
#14
Exceptional
7.4%
Puget Sound Salish
100.0
/100
|
#15
Exceptional
7.5%