Immigrants from the Azores vs Italian Unemployment Among Youth under 25 years
COMPARE
Immigrants from the Azores
Italian
Unemployment Among Youth under 25 years
Unemployment Among Youth under 25 years Comparison
Immigrants from the Azores
Italians
12.2%
UNEMPLOYMENT AMONG YOUTH UNDER 25 YEARS
0.6/ 100
METRIC RATING
243rd/ 347
METRIC RANK
11.4%
UNEMPLOYMENT AMONG YOUTH UNDER 25 YEARS
87.2/ 100
METRIC RATING
124th/ 347
METRIC RANK
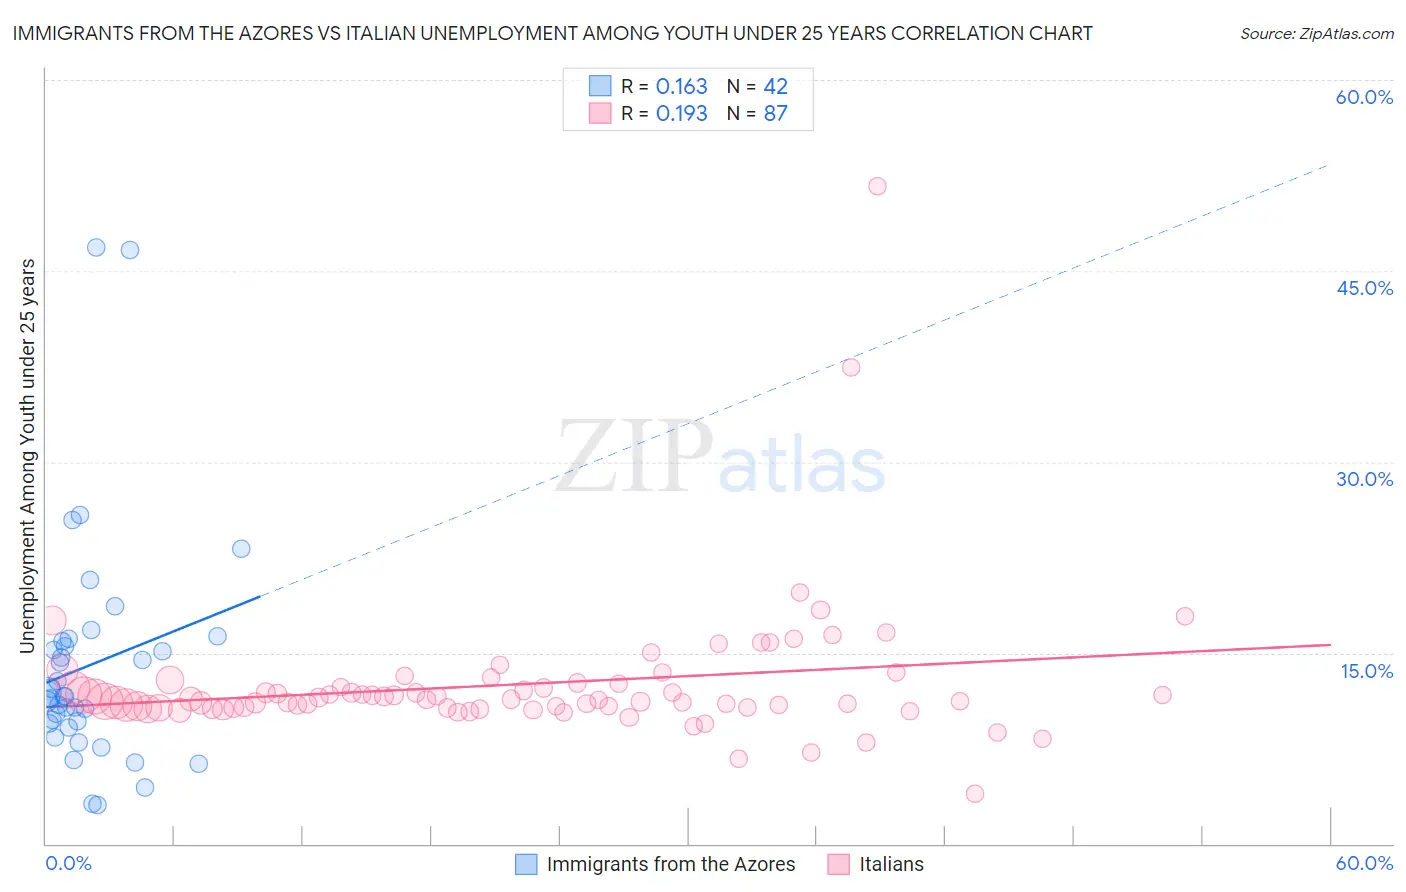
Immigrants from the Azores vs Italian Unemployment Among Youth under 25 years Correlation Chart
The statistical analysis conducted on geographies consisting of 46,132,874 people shows a poor positive correlation between the proportion of Immigrants from the Azores and unemployment rate among youth under the age of 25 in the United States with a correlation coefficient (R) of 0.163 and weighted average of 12.2%. Similarly, the statistical analysis conducted on geographies consisting of 549,839,385 people shows a poor positive correlation between the proportion of Italians and unemployment rate among youth under the age of 25 in the United States with a correlation coefficient (R) of 0.193 and weighted average of 11.4%, a difference of 7.3%.
Unemployment Among Youth under 25 years Correlation Summary
| Measurement | Immigrants from the Azores | Italian |
| Minimum | 3.0% | 3.9% |
| Maximum | 46.8% | 51.7% |
| Range | 43.8% | 47.8% |
| Mean | 14.0% | 12.5% |
| Median | 11.6% | 11.3% |
| Interquartile 25% (IQ1) | 9.4% | 10.7% |
| Interquartile 75% (IQ3) | 15.9% | 12.6% |
| Interquartile Range (IQR) | 6.5% | 1.8% |
| Standard Deviation (Sample) | 9.1% | 5.6% |
| Standard Deviation (Population) | 9.0% | 5.6% |
Similar Demographics by Unemployment Among Youth under 25 years
Demographics Similar to Immigrants from the Azores by Unemployment Among Youth under 25 years
In terms of unemployment among youth under 25 years, the demographic groups most similar to Immigrants from the Azores are Alaskan Athabascan (12.2%, a difference of 0.0%), Spanish American (12.2%, a difference of 0.010%), Immigrants from Honduras (12.2%, a difference of 0.020%), Immigrants from Greece (12.2%, a difference of 0.13%), and Central American (12.2%, a difference of 0.14%).
| Demographics | Rating | Rank | Unemployment Among Youth under 25 years |
| Immigrants | Immigrants | 1.3 /100 | #236 | Tragic 12.1% |
| Native Hawaiians | 1.3 /100 | #237 | Tragic 12.1% |
| Albanians | 1.2 /100 | #238 | Tragic 12.1% |
| Immigrants | Africa | 1.1 /100 | #239 | Tragic 12.1% |
| Dutch West Indians | 1.1 /100 | #240 | Tragic 12.1% |
| Immigrants | Albania | 1.1 /100 | #241 | Tragic 12.1% |
| Immigrants | Western Asia | 0.8 /100 | #242 | Tragic 12.2% |
| Immigrants | Azores | 0.6 /100 | #243 | Tragic 12.2% |
| Alaskan Athabascans | 0.6 /100 | #244 | Tragic 12.2% |
| Spanish Americans | 0.6 /100 | #245 | Tragic 12.2% |
| Immigrants | Honduras | 0.6 /100 | #246 | Tragic 12.2% |
| Immigrants | Greece | 0.6 /100 | #247 | Tragic 12.2% |
| Central Americans | 0.6 /100 | #248 | Tragic 12.2% |
| Soviet Union | 0.6 /100 | #249 | Tragic 12.2% |
| Delaware | 0.4 /100 | #250 | Tragic 12.3% |
Demographics Similar to Italians by Unemployment Among Youth under 25 years
In terms of unemployment among youth under 25 years, the demographic groups most similar to Italians are Immigrants from Argentina (11.4%, a difference of 0.0%), Canadian (11.4%, a difference of 0.050%), Basque (11.4%, a difference of 0.060%), Immigrants from Micronesia (11.4%, a difference of 0.090%), and Greek (11.4%, a difference of 0.090%).
| Demographics | Rating | Rank | Unemployment Among Youth under 25 years |
| Sri Lankans | 89.8 /100 | #117 | Excellent 11.3% |
| Afghans | 89.7 /100 | #118 | Excellent 11.3% |
| Immigrants | Scotland | 89.2 /100 | #119 | Excellent 11.4% |
| Malaysians | 89.0 /100 | #120 | Excellent 11.4% |
| Slovaks | 88.9 /100 | #121 | Excellent 11.4% |
| Immigrants | Micronesia | 88.1 /100 | #122 | Excellent 11.4% |
| Basques | 87.8 /100 | #123 | Excellent 11.4% |
| Italians | 87.2 /100 | #124 | Excellent 11.4% |
| Immigrants | Argentina | 87.2 /100 | #125 | Excellent 11.4% |
| Canadians | 86.6 /100 | #126 | Excellent 11.4% |
| Greeks | 86.2 /100 | #127 | Excellent 11.4% |
| Immigrants | Hungary | 86.0 /100 | #128 | Excellent 11.4% |
| Turks | 85.8 /100 | #129 | Excellent 11.4% |
| Hungarians | 85.7 /100 | #130 | Excellent 11.4% |
| Immigrants | Spain | 84.6 /100 | #131 | Excellent 11.4% |