Immigrants from the Azores vs Hispanic or Latino Unemployment Among Youth under 25 years
COMPARE
Immigrants from the Azores
Hispanic or Latino
Unemployment Among Youth under 25 years
Unemployment Among Youth under 25 years Comparison
Immigrants from the Azores
Hispanics or Latinos
12.2%
UNEMPLOYMENT AMONG YOUTH UNDER 25 YEARS
0.6/ 100
METRIC RATING
243rd/ 347
METRIC RANK
12.4%
UNEMPLOYMENT AMONG YOUTH UNDER 25 YEARS
0.2/ 100
METRIC RATING
255th/ 347
METRIC RANK
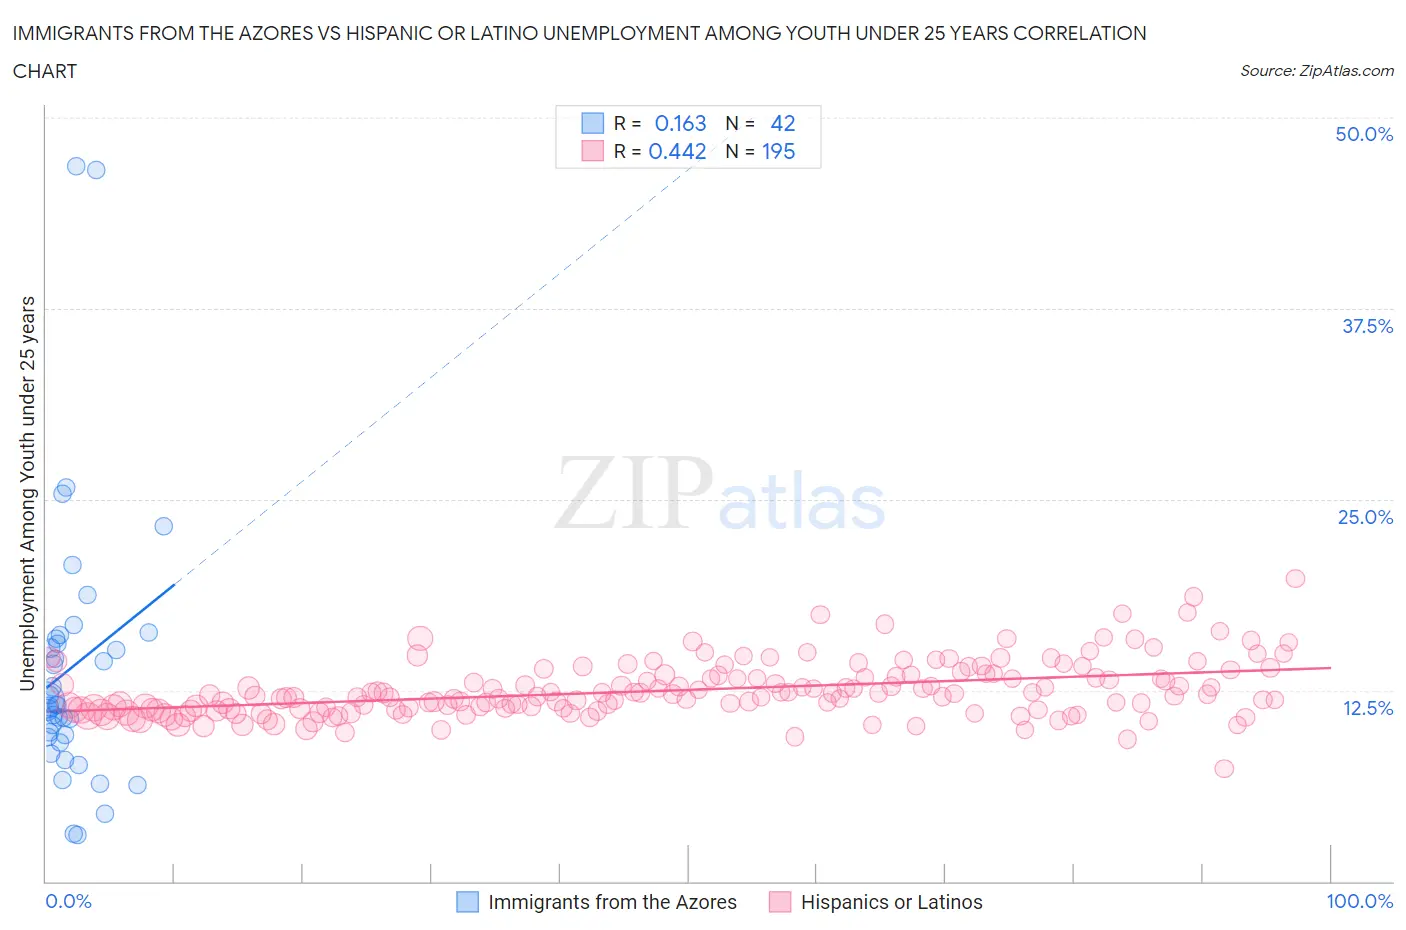
Immigrants from the Azores vs Hispanic or Latino Unemployment Among Youth under 25 years Correlation Chart
The statistical analysis conducted on geographies consisting of 46,132,874 people shows a poor positive correlation between the proportion of Immigrants from the Azores and unemployment rate among youth under the age of 25 in the United States with a correlation coefficient (R) of 0.163 and weighted average of 12.2%. Similarly, the statistical analysis conducted on geographies consisting of 547,783,299 people shows a moderate positive correlation between the proportion of Hispanics or Latinos and unemployment rate among youth under the age of 25 in the United States with a correlation coefficient (R) of 0.442 and weighted average of 12.4%, a difference of 1.3%.
Unemployment Among Youth under 25 years Correlation Summary
| Measurement | Immigrants from the Azores | Hispanic or Latino |
| Minimum | 3.0% | 7.4% |
| Maximum | 46.8% | 19.8% |
| Range | 43.8% | 12.5% |
| Mean | 14.0% | 12.5% |
| Median | 11.6% | 12.1% |
| Interquartile 25% (IQ1) | 9.4% | 11.2% |
| Interquartile 75% (IQ3) | 15.9% | 13.5% |
| Interquartile Range (IQR) | 6.5% | 2.2% |
| Standard Deviation (Sample) | 9.1% | 1.8% |
| Standard Deviation (Population) | 9.0% | 1.8% |
Demographics Similar to Immigrants from the Azores and Hispanics or Latinos by Unemployment Among Youth under 25 years
In terms of unemployment among youth under 25 years, the demographic groups most similar to Immigrants from the Azores are Alaskan Athabascan (12.2%, a difference of 0.0%), Spanish American (12.2%, a difference of 0.010%), Immigrants from Honduras (12.2%, a difference of 0.020%), Immigrants from Greece (12.2%, a difference of 0.13%), and Central American (12.2%, a difference of 0.14%). Similarly, the demographic groups most similar to Hispanics or Latinos are Liberian (12.4%, a difference of 0.070%), Panamanian (12.4%, a difference of 0.080%), Salvadoran (12.4%, a difference of 0.11%), Immigrants from Central America (12.4%, a difference of 0.17%), and Honduran (12.3%, a difference of 0.63%).
| Demographics | Rating | Rank | Unemployment Among Youth under 25 years |
| Immigrants | Africa | 1.1 /100 | #239 | Tragic 12.1% |
| Dutch West Indians | 1.1 /100 | #240 | Tragic 12.1% |
| Immigrants | Albania | 1.1 /100 | #241 | Tragic 12.1% |
| Immigrants | Western Asia | 0.8 /100 | #242 | Tragic 12.2% |
| Immigrants | Azores | 0.6 /100 | #243 | Tragic 12.2% |
| Alaskan Athabascans | 0.6 /100 | #244 | Tragic 12.2% |
| Spanish Americans | 0.6 /100 | #245 | Tragic 12.2% |
| Immigrants | Honduras | 0.6 /100 | #246 | Tragic 12.2% |
| Immigrants | Greece | 0.6 /100 | #247 | Tragic 12.2% |
| Central Americans | 0.6 /100 | #248 | Tragic 12.2% |
| Soviet Union | 0.6 /100 | #249 | Tragic 12.2% |
| Delaware | 0.4 /100 | #250 | Tragic 12.3% |
| Mexican American Indians | 0.4 /100 | #251 | Tragic 12.3% |
| Immigrants | Syria | 0.3 /100 | #252 | Tragic 12.3% |
| Mexicans | 0.3 /100 | #253 | Tragic 12.3% |
| Hondurans | 0.3 /100 | #254 | Tragic 12.3% |
| Hispanics or Latinos | 0.2 /100 | #255 | Tragic 12.4% |
| Liberians | 0.2 /100 | #256 | Tragic 12.4% |
| Panamanians | 0.2 /100 | #257 | Tragic 12.4% |
| Salvadorans | 0.1 /100 | #258 | Tragic 12.4% |
| Immigrants | Central America | 0.1 /100 | #259 | Tragic 12.4% |