Immigrants from the Azores vs German Russian Unemployment Among Seniors over 75 years
COMPARE
Immigrants from the Azores
German Russian
Unemployment Among Seniors over 75 years
Unemployment Among Seniors over 75 years Comparison
Immigrants from the Azores
German Russians
10.7%
UNEMPLOYMENT AMONG SENIORS OVER 75 YEARS
0.0/ 100
METRIC RATING
330th/ 347
METRIC RANK
8.4%
UNEMPLOYMENT AMONG SENIORS OVER 75 YEARS
94.9/ 100
METRIC RATING
131st/ 347
METRIC RANK
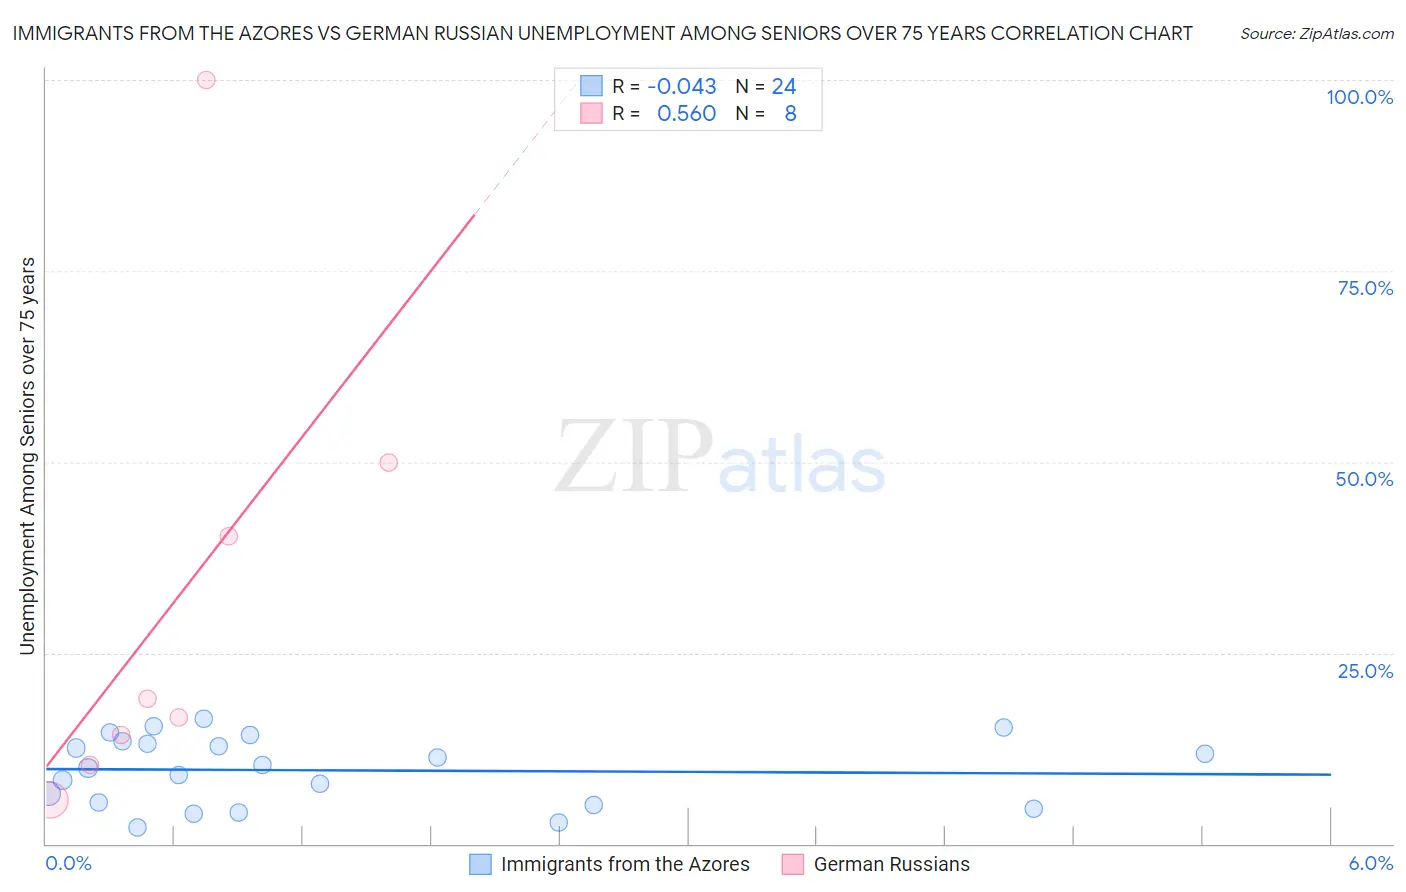
Immigrants from the Azores vs German Russian Unemployment Among Seniors over 75 years Correlation Chart
The statistical analysis conducted on geographies consisting of 32,495,694 people shows no correlation between the proportion of Immigrants from the Azores and unemployment rate among seniors over the age of 75 in the United States with a correlation coefficient (R) of -0.043 and weighted average of 10.7%. Similarly, the statistical analysis conducted on geographies consisting of 73,268,309 people shows a substantial positive correlation between the proportion of German Russians and unemployment rate among seniors over the age of 75 in the United States with a correlation coefficient (R) of 0.560 and weighted average of 8.4%, a difference of 27.4%.
Unemployment Among Seniors over 75 years Correlation Summary
| Measurement | Immigrants from the Azores | German Russian |
| Minimum | 2.1% | 5.8% |
| Maximum | 16.4% | 100.0% |
| Range | 14.3% | 94.2% |
| Mean | 9.6% | 32.0% |
| Median | 10.1% | 17.8% |
| Interquartile 25% (IQ1) | 5.2% | 12.3% |
| Interquartile 75% (IQ3) | 13.3% | 45.1% |
| Interquartile Range (IQR) | 8.0% | 32.8% |
| Standard Deviation (Sample) | 4.4% | 31.4% |
| Standard Deviation (Population) | 4.3% | 29.4% |
Similar Demographics by Unemployment Among Seniors over 75 years
Demographics Similar to Immigrants from the Azores by Unemployment Among Seniors over 75 years
In terms of unemployment among seniors over 75 years, the demographic groups most similar to Immigrants from the Azores are Tohono O'odham (10.8%, a difference of 1.0%), Tsimshian (10.5%, a difference of 1.6%), Immigrants from Liberia (10.9%, a difference of 1.8%), Immigrants from Portugal (10.5%, a difference of 1.9%), and Dutch (10.4%, a difference of 2.6%).
| Demographics | Rating | Rank | Unemployment Among Seniors over 75 years |
| Tongans | 0.0 /100 | #323 | Tragic 10.4% |
| Americans | 0.0 /100 | #324 | Tragic 10.4% |
| Portuguese | 0.0 /100 | #325 | Tragic 10.4% |
| Slovaks | 0.0 /100 | #326 | Tragic 10.4% |
| Dutch | 0.0 /100 | #327 | Tragic 10.4% |
| Immigrants | Portugal | 0.0 /100 | #328 | Tragic 10.5% |
| Tsimshian | 0.0 /100 | #329 | Tragic 10.5% |
| Immigrants | Azores | 0.0 /100 | #330 | Tragic 10.7% |
| Tohono O'odham | 0.0 /100 | #331 | Tragic 10.8% |
| Immigrants | Liberia | 0.0 /100 | #332 | Tragic 10.9% |
| Alaskan Athabascans | 0.0 /100 | #333 | Tragic 11.0% |
| Assyrians/Chaldeans/Syriacs | 0.0 /100 | #334 | Tragic 11.1% |
| French Canadians | 0.0 /100 | #335 | Tragic 11.2% |
| Immigrants | North Macedonia | 0.0 /100 | #336 | Tragic 11.3% |
| Cape Verdeans | 0.0 /100 | #337 | Tragic 11.4% |
Demographics Similar to German Russians by Unemployment Among Seniors over 75 years
In terms of unemployment among seniors over 75 years, the demographic groups most similar to German Russians are Apache (8.4%, a difference of 0.080%), Chilean (8.4%, a difference of 0.28%), Serbian (8.4%, a difference of 0.31%), Ghanaian (8.4%, a difference of 0.36%), and Native Hawaiian (8.4%, a difference of 0.39%).
| Demographics | Rating | Rank | Unemployment Among Seniors over 75 years |
| Thais | 96.8 /100 | #124 | Exceptional 8.3% |
| Immigrants | Moldova | 96.7 /100 | #125 | Exceptional 8.3% |
| Belizeans | 96.3 /100 | #126 | Exceptional 8.4% |
| Hondurans | 96.2 /100 | #127 | Exceptional 8.4% |
| Native Hawaiians | 96.1 /100 | #128 | Exceptional 8.4% |
| Ghanaians | 96.0 /100 | #129 | Exceptional 8.4% |
| Apache | 95.2 /100 | #130 | Exceptional 8.4% |
| German Russians | 94.9 /100 | #131 | Exceptional 8.4% |
| Chileans | 93.8 /100 | #132 | Exceptional 8.4% |
| Serbians | 93.7 /100 | #133 | Exceptional 8.4% |
| Immigrants | Czechoslovakia | 93.4 /100 | #134 | Exceptional 8.4% |
| Haitians | 91.4 /100 | #135 | Exceptional 8.5% |
| Immigrants | Trinidad and Tobago | 90.8 /100 | #136 | Exceptional 8.5% |
| Immigrants | Kuwait | 90.5 /100 | #137 | Exceptional 8.5% |
| Immigrants | Bulgaria | 89.6 /100 | #138 | Excellent 8.5% |