Immigrants from the Azores vs German Russian Poverty
COMPARE
Immigrants from the Azores
German Russian
Poverty
Poverty Comparison
Immigrants from the Azores
German Russians
13.1%
POVERTY
6.1/ 100
METRIC RATING
210th/ 347
METRIC RANK
13.4%
POVERTY
2.2/ 100
METRIC RATING
225th/ 347
METRIC RANK
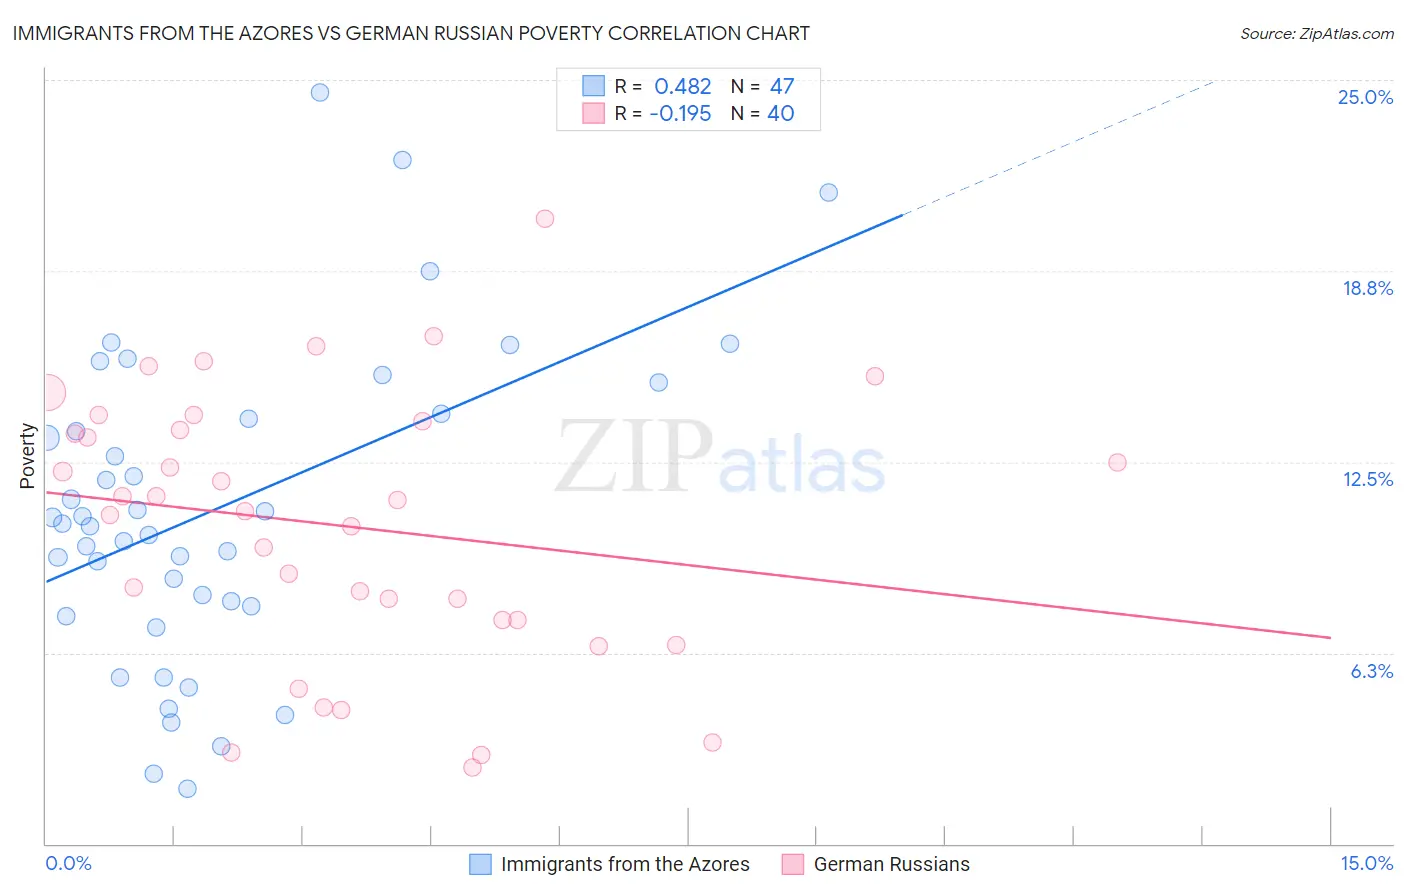
Immigrants from the Azores vs German Russian Poverty Correlation Chart
The statistical analysis conducted on geographies consisting of 46,256,915 people shows a moderate positive correlation between the proportion of Immigrants from the Azores and poverty level in the United States with a correlation coefficient (R) of 0.482 and weighted average of 13.1%. Similarly, the statistical analysis conducted on geographies consisting of 96,450,415 people shows a poor negative correlation between the proportion of German Russians and poverty level in the United States with a correlation coefficient (R) of -0.195 and weighted average of 13.4%, a difference of 2.4%.
Poverty Correlation Summary
| Measurement | Immigrants from the Azores | German Russian |
| Minimum | 1.8% | 2.5% |
| Maximum | 24.6% | 20.5% |
| Range | 22.8% | 18.0% |
| Mean | 11.0% | 10.4% |
| Median | 10.5% | 11.1% |
| Interquartile 25% (IQ1) | 7.8% | 7.3% |
| Interquartile 75% (IQ3) | 14.1% | 13.7% |
| Interquartile Range (IQR) | 6.3% | 6.4% |
| Standard Deviation (Sample) | 5.1% | 4.4% |
| Standard Deviation (Population) | 5.1% | 4.3% |
Demographics Similar to Immigrants from the Azores and German Russians by Poverty
In terms of poverty, the demographic groups most similar to Immigrants from the Azores are Malaysian (13.1%, a difference of 0.030%), Ugandan (13.1%, a difference of 0.060%), Panamanian (13.1%, a difference of 0.21%), Moroccan (13.2%, a difference of 0.35%), and Immigrants (13.2%, a difference of 0.80%). Similarly, the demographic groups most similar to German Russians are Marshallese (13.4%, a difference of 0.010%), Alaska Native (13.5%, a difference of 0.16%), Immigrants from Eritrea (13.4%, a difference of 0.22%), Immigrants from Africa (13.4%, a difference of 0.31%), and Immigrants from Micronesia (13.4%, a difference of 0.35%).
| Demographics | Rating | Rank | Poverty |
| Panamanians | 6.6 /100 | #207 | Tragic 13.1% |
| Ugandans | 6.2 /100 | #208 | Tragic 13.1% |
| Malaysians | 6.1 /100 | #209 | Tragic 13.1% |
| Immigrants | Azores | 6.1 /100 | #210 | Tragic 13.1% |
| Moroccans | 5.2 /100 | #211 | Tragic 13.2% |
| Immigrants | Immigrants | 4.3 /100 | #212 | Tragic 13.2% |
| Immigrants | Panama | 4.1 /100 | #213 | Tragic 13.3% |
| Bermudans | 3.7 /100 | #214 | Tragic 13.3% |
| Japanese | 3.3 /100 | #215 | Tragic 13.3% |
| Immigrants | Nonimmigrants | 3.3 /100 | #216 | Tragic 13.3% |
| Immigrants | Uzbekistan | 3.2 /100 | #217 | Tragic 13.3% |
| Immigrants | Thailand | 3.1 /100 | #218 | Tragic 13.3% |
| Immigrants | Cambodia | 3.0 /100 | #219 | Tragic 13.4% |
| Americans | 2.9 /100 | #220 | Tragic 13.4% |
| Alsatians | 2.6 /100 | #221 | Tragic 13.4% |
| Immigrants | Micronesia | 2.6 /100 | #222 | Tragic 13.4% |
| Immigrants | Africa | 2.5 /100 | #223 | Tragic 13.4% |
| Immigrants | Eritrea | 2.4 /100 | #224 | Tragic 13.4% |
| German Russians | 2.2 /100 | #225 | Tragic 13.4% |
| Marshallese | 2.2 /100 | #226 | Tragic 13.4% |
| Alaska Natives | 2.1 /100 | #227 | Tragic 13.5% |