Panamanian vs German Russian Unemployment Among Seniors over 75 years
COMPARE
Panamanian
German Russian
Unemployment Among Seniors over 75 years
Unemployment Among Seniors over 75 years Comparison
Panamanians
German Russians
9.1%
UNEMPLOYMENT AMONG SENIORS OVER 75 YEARS
4.0/ 100
METRIC RATING
235th/ 347
METRIC RANK
8.4%
UNEMPLOYMENT AMONG SENIORS OVER 75 YEARS
94.9/ 100
METRIC RATING
131st/ 347
METRIC RANK
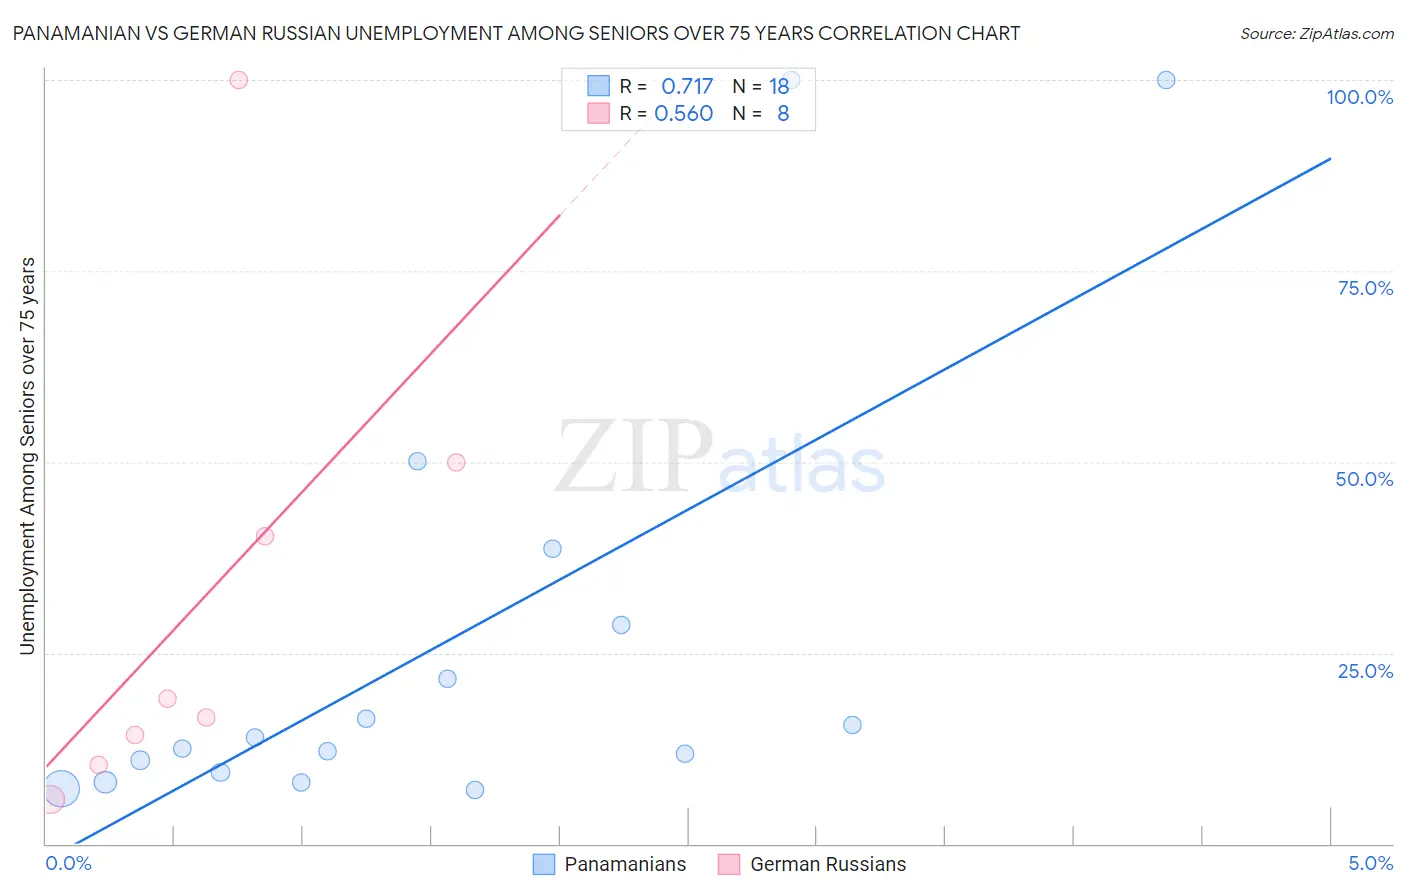
Panamanian vs German Russian Unemployment Among Seniors over 75 years Correlation Chart
The statistical analysis conducted on geographies consisting of 160,542,886 people shows a strong positive correlation between the proportion of Panamanians and unemployment rate among seniors over the age of 75 in the United States with a correlation coefficient (R) of 0.717 and weighted average of 9.1%. Similarly, the statistical analysis conducted on geographies consisting of 73,268,309 people shows a substantial positive correlation between the proportion of German Russians and unemployment rate among seniors over the age of 75 in the United States with a correlation coefficient (R) of 0.560 and weighted average of 8.4%, a difference of 8.5%.
Unemployment Among Seniors over 75 years Correlation Summary
| Measurement | Panamanian | German Russian |
| Minimum | 7.1% | 5.8% |
| Maximum | 100.0% | 100.0% |
| Range | 92.9% | 94.2% |
| Mean | 26.2% | 32.0% |
| Median | 13.2% | 17.8% |
| Interquartile 25% (IQ1) | 9.4% | 12.3% |
| Interquartile 75% (IQ3) | 28.6% | 45.1% |
| Interquartile Range (IQR) | 19.2% | 32.8% |
| Standard Deviation (Sample) | 29.2% | 31.4% |
| Standard Deviation (Population) | 28.4% | 29.4% |
Similar Demographics by Unemployment Among Seniors over 75 years
Demographics Similar to Panamanians by Unemployment Among Seniors over 75 years
In terms of unemployment among seniors over 75 years, the demographic groups most similar to Panamanians are Jordanian (9.1%, a difference of 0.010%), Houma (9.1%, a difference of 0.040%), Inupiat (9.1%, a difference of 0.14%), Vietnamese (9.1%, a difference of 0.19%), and Mexican (9.1%, a difference of 0.20%).
| Demographics | Rating | Rank | Unemployment Among Seniors over 75 years |
| Kenyans | 5.4 /100 | #228 | Tragic 9.1% |
| Hispanics or Latinos | 5.0 /100 | #229 | Tragic 9.1% |
| Northern Europeans | 4.9 /100 | #230 | Tragic 9.1% |
| Immigrants | Central America | 4.9 /100 | #231 | Tragic 9.1% |
| Africans | 4.9 /100 | #232 | Tragic 9.1% |
| Yugoslavians | 4.8 /100 | #233 | Tragic 9.1% |
| Vietnamese | 4.6 /100 | #234 | Tragic 9.1% |
| Panamanians | 4.0 /100 | #235 | Tragic 9.1% |
| Jordanians | 4.0 /100 | #236 | Tragic 9.1% |
| Houma | 3.9 /100 | #237 | Tragic 9.1% |
| Inupiat | 3.6 /100 | #238 | Tragic 9.1% |
| Mexicans | 3.5 /100 | #239 | Tragic 9.1% |
| Spanish | 3.3 /100 | #240 | Tragic 9.1% |
| Immigrants | Southern Europe | 2.8 /100 | #241 | Tragic 9.2% |
| Sierra Leoneans | 2.8 /100 | #242 | Tragic 9.2% |
Demographics Similar to German Russians by Unemployment Among Seniors over 75 years
In terms of unemployment among seniors over 75 years, the demographic groups most similar to German Russians are Apache (8.4%, a difference of 0.080%), Chilean (8.4%, a difference of 0.28%), Serbian (8.4%, a difference of 0.31%), Ghanaian (8.4%, a difference of 0.36%), and Native Hawaiian (8.4%, a difference of 0.39%).
| Demographics | Rating | Rank | Unemployment Among Seniors over 75 years |
| Thais | 96.8 /100 | #124 | Exceptional 8.3% |
| Immigrants | Moldova | 96.7 /100 | #125 | Exceptional 8.3% |
| Belizeans | 96.3 /100 | #126 | Exceptional 8.4% |
| Hondurans | 96.2 /100 | #127 | Exceptional 8.4% |
| Native Hawaiians | 96.1 /100 | #128 | Exceptional 8.4% |
| Ghanaians | 96.0 /100 | #129 | Exceptional 8.4% |
| Apache | 95.2 /100 | #130 | Exceptional 8.4% |
| German Russians | 94.9 /100 | #131 | Exceptional 8.4% |
| Chileans | 93.8 /100 | #132 | Exceptional 8.4% |
| Serbians | 93.7 /100 | #133 | Exceptional 8.4% |
| Immigrants | Czechoslovakia | 93.4 /100 | #134 | Exceptional 8.4% |
| Haitians | 91.4 /100 | #135 | Exceptional 8.5% |
| Immigrants | Trinidad and Tobago | 90.8 /100 | #136 | Exceptional 8.5% |
| Immigrants | Kuwait | 90.5 /100 | #137 | Exceptional 8.5% |
| Immigrants | Bulgaria | 89.6 /100 | #138 | Excellent 8.5% |