Immigrants from Austria vs Immigrants from Hong Kong Unemployment Among Women with Children Ages 6 to 17 years
COMPARE
Immigrants from Austria
Immigrants from Hong Kong
Unemployment Among Women with Children Ages 6 to 17 years
Unemployment Among Women with Children Ages 6 to 17 years Comparison
Immigrants from Austria
Immigrants from Hong Kong
8.8%
UNEMPLOYMENT AMONG WOMEN WITH CHILDREN AGES 6 TO 17 YEARS
87.5/ 100
METRIC RATING
142nd/ 347
METRIC RANK
7.2%
UNEMPLOYMENT AMONG WOMEN WITH CHILDREN AGES 6 TO 17 YEARS
100.0/ 100
METRIC RATING
8th/ 347
METRIC RANK
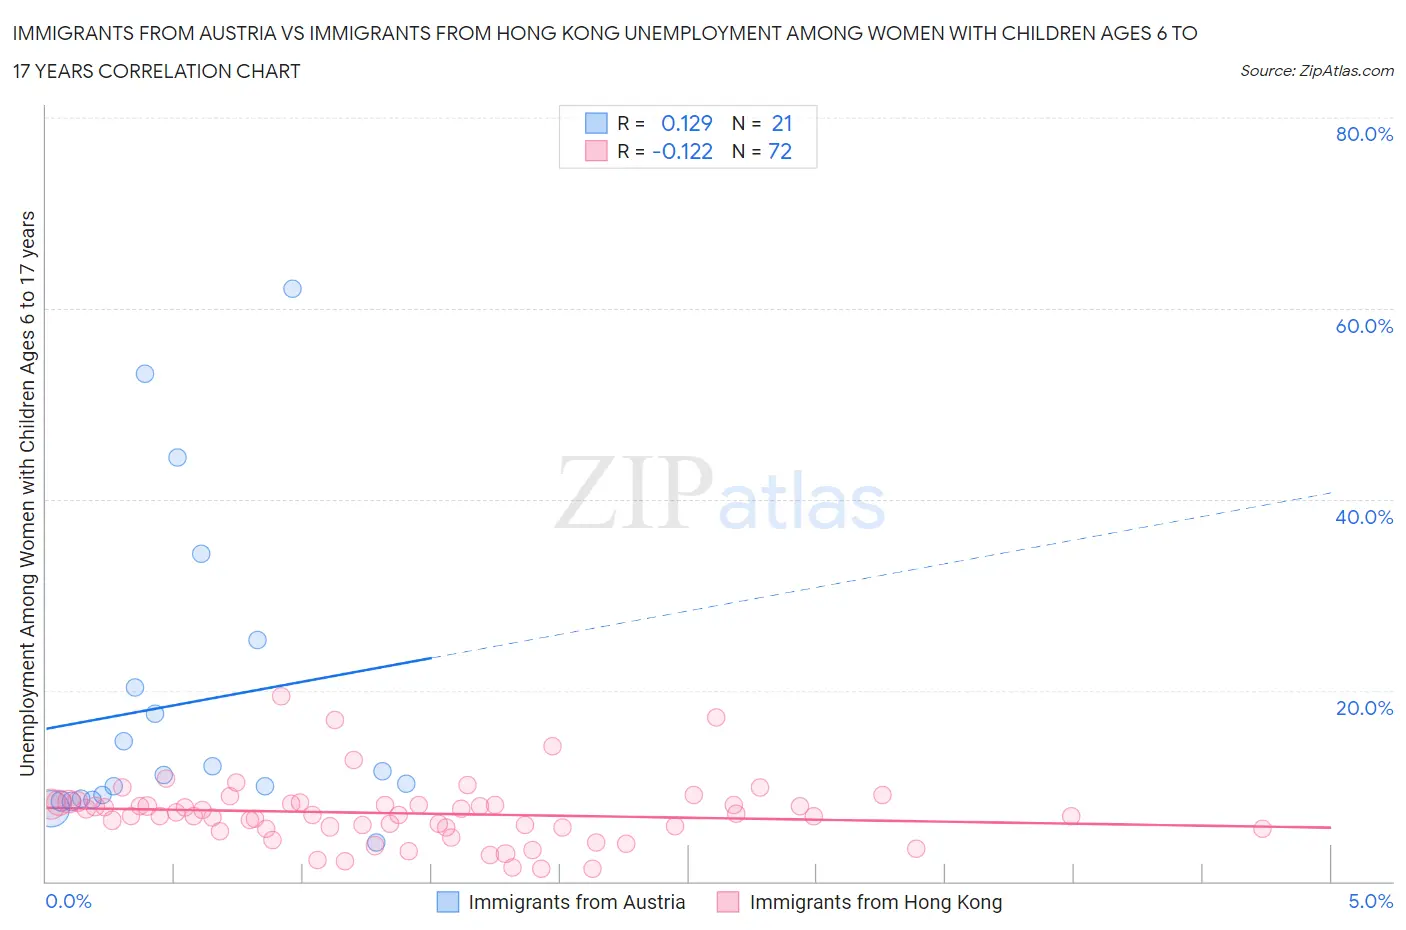
Immigrants from Austria vs Immigrants from Hong Kong Unemployment Among Women with Children Ages 6 to 17 years Correlation Chart
The statistical analysis conducted on geographies consisting of 134,337,989 people shows a poor positive correlation between the proportion of Immigrants from Austria and unemployment rate among women with children between the ages 6 and 17 in the United States with a correlation coefficient (R) of 0.129 and weighted average of 8.8%. Similarly, the statistical analysis conducted on geographies consisting of 197,270,459 people shows a poor negative correlation between the proportion of Immigrants from Hong Kong and unemployment rate among women with children between the ages 6 and 17 in the United States with a correlation coefficient (R) of -0.122 and weighted average of 7.2%, a difference of 22.1%.
Unemployment Among Women with Children Ages 6 to 17 years Correlation Summary
| Measurement | Immigrants from Austria | Immigrants from Hong Kong |
| Minimum | 4.0% | 1.3% |
| Maximum | 62.0% | 19.4% |
| Range | 58.0% | 18.1% |
| Mean | 18.6% | 7.1% |
| Median | 11.2% | 6.9% |
| Interquartile 25% (IQ1) | 8.6% | 5.6% |
| Interquartile 75% (IQ3) | 22.8% | 8.1% |
| Interquartile Range (IQR) | 14.2% | 2.5% |
| Standard Deviation (Sample) | 16.2% | 3.4% |
| Standard Deviation (Population) | 15.8% | 3.3% |
Similar Demographics by Unemployment Among Women with Children Ages 6 to 17 years
Demographics Similar to Immigrants from Austria by Unemployment Among Women with Children Ages 6 to 17 years
In terms of unemployment among women with children ages 6 to 17 years, the demographic groups most similar to Immigrants from Austria are Serbian (8.8%, a difference of 0.020%), Immigrants from Poland (8.8%, a difference of 0.080%), Immigrants from Kenya (8.8%, a difference of 0.13%), Russian (8.8%, a difference of 0.16%), and Kenyan (8.8%, a difference of 0.18%).
| Demographics | Rating | Rank | Unemployment Among Women with Children Ages 6 to 17 years |
| Europeans | 90.6 /100 | #135 | Exceptional 8.7% |
| Immigrants | Latvia | 90.4 /100 | #136 | Exceptional 8.7% |
| Immigrants | Argentina | 90.0 /100 | #137 | Excellent 8.7% |
| Immigrants | Ethiopia | 89.5 /100 | #138 | Excellent 8.8% |
| Northern Europeans | 89.2 /100 | #139 | Excellent 8.8% |
| Immigrants | Poland | 88.3 /100 | #140 | Excellent 8.8% |
| Serbians | 87.6 /100 | #141 | Excellent 8.8% |
| Immigrants | Austria | 87.5 /100 | #142 | Excellent 8.8% |
| Immigrants | Kenya | 86.1 /100 | #143 | Excellent 8.8% |
| Russians | 85.8 /100 | #144 | Excellent 8.8% |
| Kenyans | 85.6 /100 | #145 | Excellent 8.8% |
| Chileans | 80.8 /100 | #146 | Excellent 8.8% |
| Immigrants | Bangladesh | 79.4 /100 | #147 | Good 8.8% |
| Costa Ricans | 77.0 /100 | #148 | Good 8.8% |
| Croatians | 76.0 /100 | #149 | Good 8.8% |
Demographics Similar to Immigrants from Hong Kong by Unemployment Among Women with Children Ages 6 to 17 years
In terms of unemployment among women with children ages 6 to 17 years, the demographic groups most similar to Immigrants from Hong Kong are Assyrian/Chaldean/Syriac (7.2%, a difference of 0.31%), Immigrants from Fiji (7.3%, a difference of 1.3%), Soviet Union (7.1%, a difference of 1.4%), Tlingit-Haida (7.1%, a difference of 1.5%), and Okinawan (7.0%, a difference of 2.0%).
| Demographics | Rating | Rank | Unemployment Among Women with Children Ages 6 to 17 years |
| Taiwanese | 100.0 /100 | #1 | Exceptional 6.5% |
| Fijians | 100.0 /100 | #2 | Exceptional 6.6% |
| Tongans | 100.0 /100 | #3 | Exceptional 6.7% |
| Ute | 100.0 /100 | #4 | Exceptional 7.0% |
| Okinawans | 100.0 /100 | #5 | Exceptional 7.0% |
| Tlingit-Haida | 100.0 /100 | #6 | Exceptional 7.1% |
| Soviet Union | 100.0 /100 | #7 | Exceptional 7.1% |
| Immigrants | Hong Kong | 100.0 /100 | #8 | Exceptional 7.2% |
| Assyrians/Chaldeans/Syriacs | 100.0 /100 | #9 | Exceptional 7.2% |
| Immigrants | Fiji | 100.0 /100 | #10 | Exceptional 7.3% |
| Immigrants | Taiwan | 100.0 /100 | #11 | Exceptional 7.3% |
| Bangladeshis | 100.0 /100 | #12 | Exceptional 7.4% |
| Indonesians | 100.0 /100 | #13 | Exceptional 7.4% |
| Sudanese | 100.0 /100 | #14 | Exceptional 7.4% |
| Puget Sound Salish | 100.0 /100 | #15 | Exceptional 7.5% |