Honduran vs Immigrants from Oceania Female Unemployment
COMPARE
Honduran
Immigrants from Oceania
Female Unemployment
Female Unemployment Comparison
Hondurans
Immigrants from Oceania
5.9%
FEMALE UNEMPLOYMENT
0.0/ 100
METRIC RATING
268th/ 347
METRIC RANK
5.2%
FEMALE UNEMPLOYMENT
79.5/ 100
METRIC RATING
145th/ 347
METRIC RANK
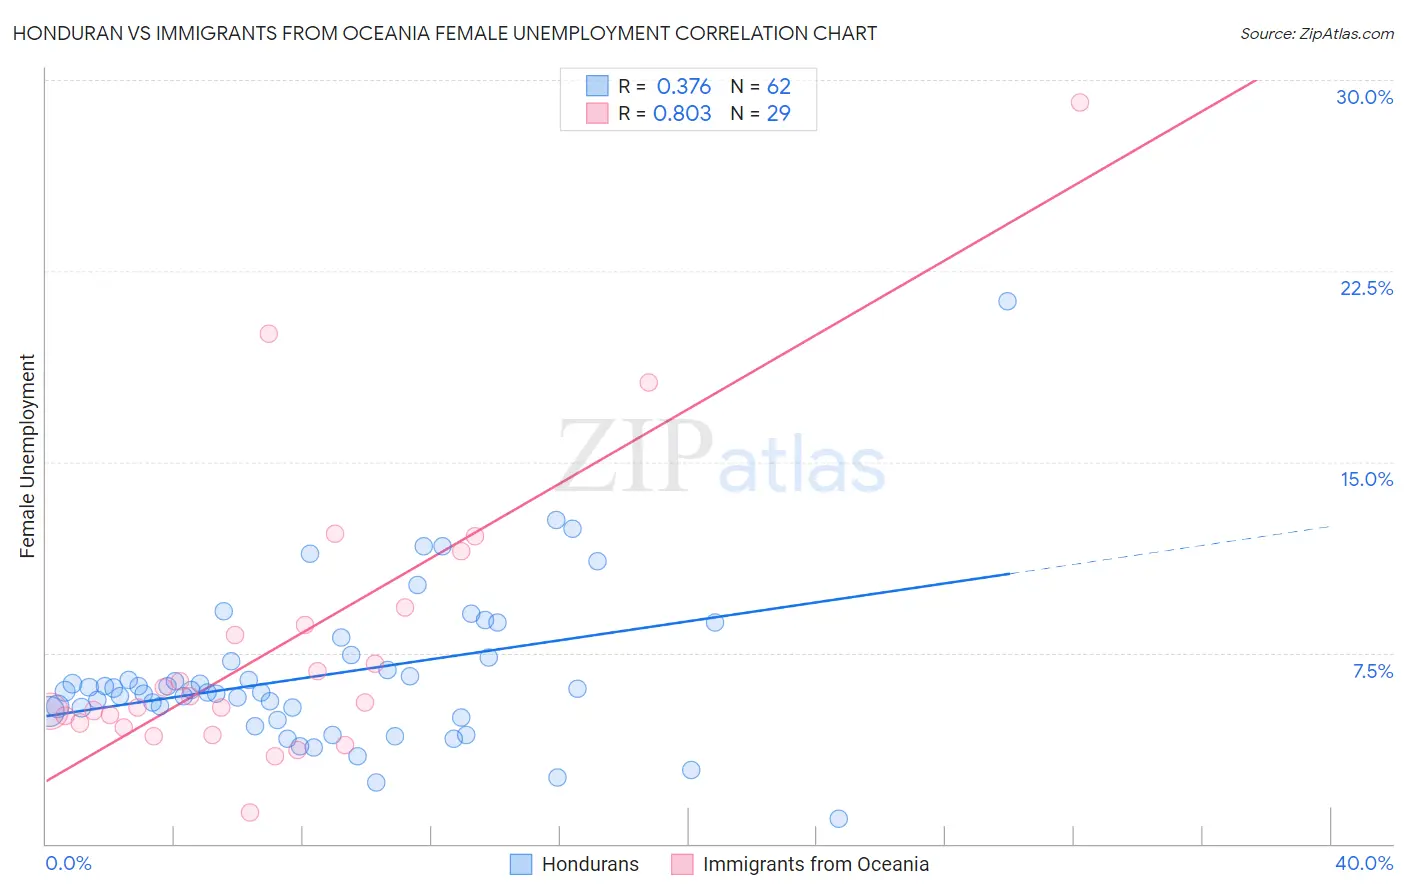
Honduran vs Immigrants from Oceania Female Unemployment Correlation Chart
The statistical analysis conducted on geographies consisting of 356,669,168 people shows a mild positive correlation between the proportion of Hondurans and unemploymnet rate among females in the United States with a correlation coefficient (R) of 0.376 and weighted average of 5.9%. Similarly, the statistical analysis conducted on geographies consisting of 304,351,716 people shows a very strong positive correlation between the proportion of Immigrants from Oceania and unemploymnet rate among females in the United States with a correlation coefficient (R) of 0.803 and weighted average of 5.2%, a difference of 14.4%.
Female Unemployment Correlation Summary
| Measurement | Honduran | Immigrants from Oceania |
| Minimum | 1.0% | 1.2% |
| Maximum | 21.3% | 29.1% |
| Range | 20.3% | 27.9% |
| Mean | 6.6% | 7.9% |
| Median | 6.0% | 5.5% |
| Interquartile 25% (IQ1) | 5.2% | 4.7% |
| Interquartile 75% (IQ3) | 7.3% | 8.9% |
| Interquartile Range (IQR) | 2.1% | 4.3% |
| Standard Deviation (Sample) | 3.1% | 5.9% |
| Standard Deviation (Population) | 3.1% | 5.8% |
Similar Demographics by Female Unemployment
Demographics Similar to Hondurans by Female Unemployment
In terms of female unemployment, the demographic groups most similar to Hondurans are Nepalese (5.9%, a difference of 0.10%), Cape Verdean (5.9%, a difference of 0.20%), Immigrants from Western Africa (5.9%, a difference of 0.20%), Blackfeet (5.9%, a difference of 0.48%), and Immigrants from Honduras (5.9%, a difference of 0.61%).
| Demographics | Rating | Rank | Female Unemployment |
| Kiowa | 0.1 /100 | #261 | Tragic 5.8% |
| Immigrants | Nigeria | 0.1 /100 | #262 | Tragic 5.8% |
| Immigrants | Azores | 0.1 /100 | #263 | Tragic 5.8% |
| Immigrants | Bahamas | 0.1 /100 | #264 | Tragic 5.8% |
| Blackfeet | 0.0 /100 | #265 | Tragic 5.9% |
| Cape Verdeans | 0.0 /100 | #266 | Tragic 5.9% |
| Nepalese | 0.0 /100 | #267 | Tragic 5.9% |
| Hondurans | 0.0 /100 | #268 | Tragic 5.9% |
| Immigrants | Western Africa | 0.0 /100 | #269 | Tragic 5.9% |
| Immigrants | Honduras | 0.0 /100 | #270 | Tragic 5.9% |
| Central Americans | 0.0 /100 | #271 | Tragic 5.9% |
| Lumbee | 0.0 /100 | #272 | Tragic 5.9% |
| Ghanaians | 0.0 /100 | #273 | Tragic 5.9% |
| Africans | 0.0 /100 | #274 | Tragic 5.9% |
| Senegalese | 0.0 /100 | #275 | Tragic 6.0% |
Demographics Similar to Immigrants from Oceania by Female Unemployment
In terms of female unemployment, the demographic groups most similar to Immigrants from Oceania are Immigrants from Norway (5.2%, a difference of 0.010%), Argentinean (5.2%, a difference of 0.030%), Immigrants from Argentina (5.2%, a difference of 0.070%), Immigrants from Jordan (5.1%, a difference of 0.090%), and Asian (5.2%, a difference of 0.11%).
| Demographics | Rating | Rank | Female Unemployment |
| Chickasaw | 83.2 /100 | #138 | Excellent 5.1% |
| Immigrants | Eastern Asia | 83.0 /100 | #139 | Excellent 5.1% |
| Immigrants | France | 82.7 /100 | #140 | Excellent 5.1% |
| Immigrants | Eastern Europe | 81.5 /100 | #141 | Excellent 5.1% |
| Palestinians | 80.8 /100 | #142 | Excellent 5.1% |
| Immigrants | Kazakhstan | 80.7 /100 | #143 | Excellent 5.1% |
| Immigrants | Jordan | 80.4 /100 | #144 | Excellent 5.1% |
| Immigrants | Oceania | 79.5 /100 | #145 | Good 5.2% |
| Immigrants | Norway | 79.4 /100 | #146 | Good 5.2% |
| Argentineans | 79.2 /100 | #147 | Good 5.2% |
| Immigrants | Argentina | 78.7 /100 | #148 | Good 5.2% |
| Asians | 78.3 /100 | #149 | Good 5.2% |
| Egyptians | 78.3 /100 | #150 | Good 5.2% |
| Immigrants | China | 75.9 /100 | #151 | Good 5.2% |
| Immigrants | Italy | 75.0 /100 | #152 | Good 5.2% |