Guatemalan vs Barbadian Male Unemployment
COMPARE
Guatemalan
Barbadian
Male Unemployment
Male Unemployment Comparison
Guatemalans
Barbadians
5.6%
MALE UNEMPLOYMENT
1.2/ 100
METRIC RATING
236th/ 347
METRIC RANK
6.9%
MALE UNEMPLOYMENT
0.0/ 100
METRIC RATING
309th/ 347
METRIC RANK
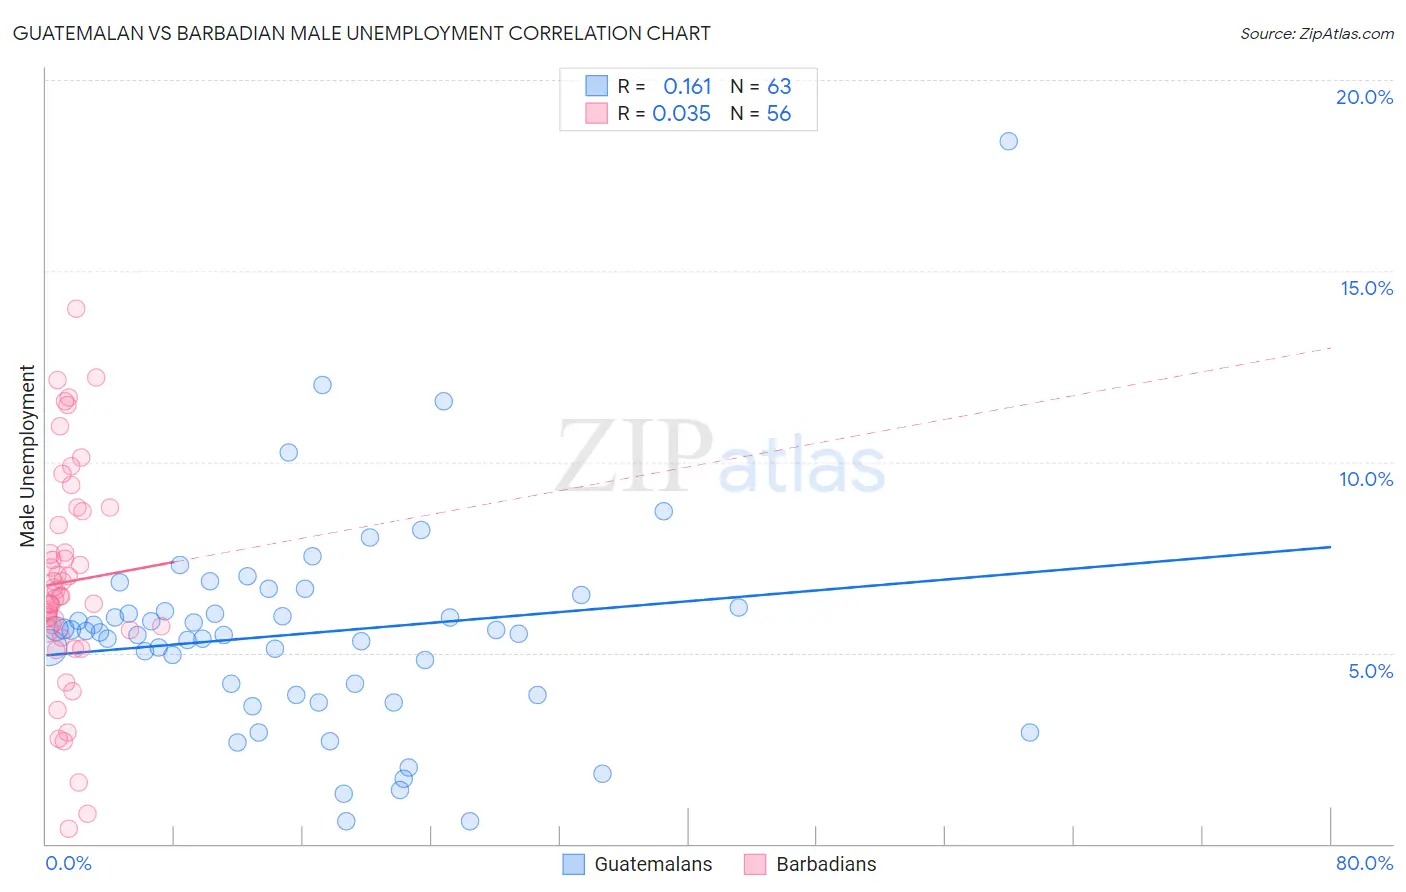
Guatemalan vs Barbadian Male Unemployment Correlation Chart
The statistical analysis conducted on geographies consisting of 407,851,547 people shows a poor positive correlation between the proportion of Guatemalans and unemployment rate among males in the United States with a correlation coefficient (R) of 0.161 and weighted average of 5.6%. Similarly, the statistical analysis conducted on geographies consisting of 141,188,365 people shows no correlation between the proportion of Barbadians and unemployment rate among males in the United States with a correlation coefficient (R) of 0.035 and weighted average of 6.9%, a difference of 21.6%.
Male Unemployment Correlation Summary
| Measurement | Guatemalan | Barbadian |
| Minimum | 0.60% | 0.40% |
| Maximum | 18.4% | 14.0% |
| Range | 17.8% | 13.6% |
| Mean | 5.5% | 6.9% |
| Median | 5.5% | 6.5% |
| Interquartile 25% (IQ1) | 3.9% | 5.6% |
| Interquartile 75% (IQ3) | 6.2% | 8.5% |
| Interquartile Range (IQR) | 2.3% | 2.9% |
| Standard Deviation (Sample) | 2.8% | 2.8% |
| Standard Deviation (Population) | 2.8% | 2.8% |
Similar Demographics by Male Unemployment
Demographics Similar to Guatemalans by Male Unemployment
In terms of male unemployment, the demographic groups most similar to Guatemalans are Honduran (5.6%, a difference of 0.090%), Native Hawaiian (5.6%, a difference of 0.14%), Immigrants from Guatemala (5.6%, a difference of 0.14%), Immigrants from Cameroon (5.6%, a difference of 0.21%), and Salvadoran (5.7%, a difference of 0.25%).
| Demographics | Rating | Rank | Male Unemployment |
| Central Americans | 1.8 /100 | #229 | Tragic 5.6% |
| Immigrants | Africa | 1.7 /100 | #230 | Tragic 5.6% |
| Choctaw | 1.6 /100 | #231 | Tragic 5.6% |
| Moroccans | 1.6 /100 | #232 | Tragic 5.6% |
| Somalis | 1.5 /100 | #233 | Tragic 5.6% |
| Immigrants | Somalia | 1.5 /100 | #234 | Tragic 5.6% |
| Immigrants | Honduras | 1.5 /100 | #235 | Tragic 5.6% |
| Guatemalans | 1.2 /100 | #236 | Tragic 5.6% |
| Hondurans | 1.1 /100 | #237 | Tragic 5.6% |
| Native Hawaiians | 1.1 /100 | #238 | Tragic 5.6% |
| Immigrants | Guatemala | 1.1 /100 | #239 | Tragic 5.6% |
| Immigrants | Cameroon | 1.0 /100 | #240 | Tragic 5.6% |
| Salvadorans | 1.0 /100 | #241 | Tragic 5.7% |
| Ottawa | 0.9 /100 | #242 | Tragic 5.7% |
| Bangladeshis | 0.8 /100 | #243 | Tragic 5.7% |
Demographics Similar to Barbadians by Male Unemployment
In terms of male unemployment, the demographic groups most similar to Barbadians are Aleut (6.8%, a difference of 0.41%), Black/African American (6.9%, a difference of 0.64%), Immigrants from Armenia (6.9%, a difference of 0.96%), Lumbee (6.9%, a difference of 1.2%), and Immigrants from Dominica (7.0%, a difference of 2.2%).
| Demographics | Rating | Rank | Male Unemployment |
| Ute | 0.0 /100 | #302 | Tragic 6.6% |
| Immigrants | West Indies | 0.0 /100 | #303 | Tragic 6.7% |
| West Indians | 0.0 /100 | #304 | Tragic 6.7% |
| Trinidadians and Tobagonians | 0.0 /100 | #305 | Tragic 6.7% |
| Immigrants | Trinidad and Tobago | 0.0 /100 | #306 | Tragic 6.7% |
| Immigrants | Jamaica | 0.0 /100 | #307 | Tragic 6.7% |
| Aleuts | 0.0 /100 | #308 | Tragic 6.8% |
| Barbadians | 0.0 /100 | #309 | Tragic 6.9% |
| Blacks/African Americans | 0.0 /100 | #310 | Tragic 6.9% |
| Immigrants | Armenia | 0.0 /100 | #311 | Tragic 6.9% |
| Lumbee | 0.0 /100 | #312 | Tragic 6.9% |
| Immigrants | Dominica | 0.0 /100 | #313 | Tragic 7.0% |
| Immigrants | Barbados | 0.0 /100 | #314 | Tragic 7.1% |
| Houma | 0.0 /100 | #315 | Tragic 7.1% |
| Immigrants | Guyana | 0.0 /100 | #316 | Tragic 7.1% |