Guamanian/Chamorro vs Subsaharan African Unemployment Among Ages 30 to 34 years
COMPARE
Guamanian/Chamorro
Subsaharan African
Unemployment Among Ages 30 to 34 years
Unemployment Among Ages 30 to 34 years Comparison
Guamanians/Chamorros
Sub-Saharan Africans
5.8%
UNEMPLOYMENT AMONG AGES 30 TO 34 YEARS
3.9/ 100
METRIC RATING
221st/ 347
METRIC RANK
6.0%
UNEMPLOYMENT AMONG AGES 30 TO 34 YEARS
0.3/ 100
METRIC RATING
245th/ 347
METRIC RANK
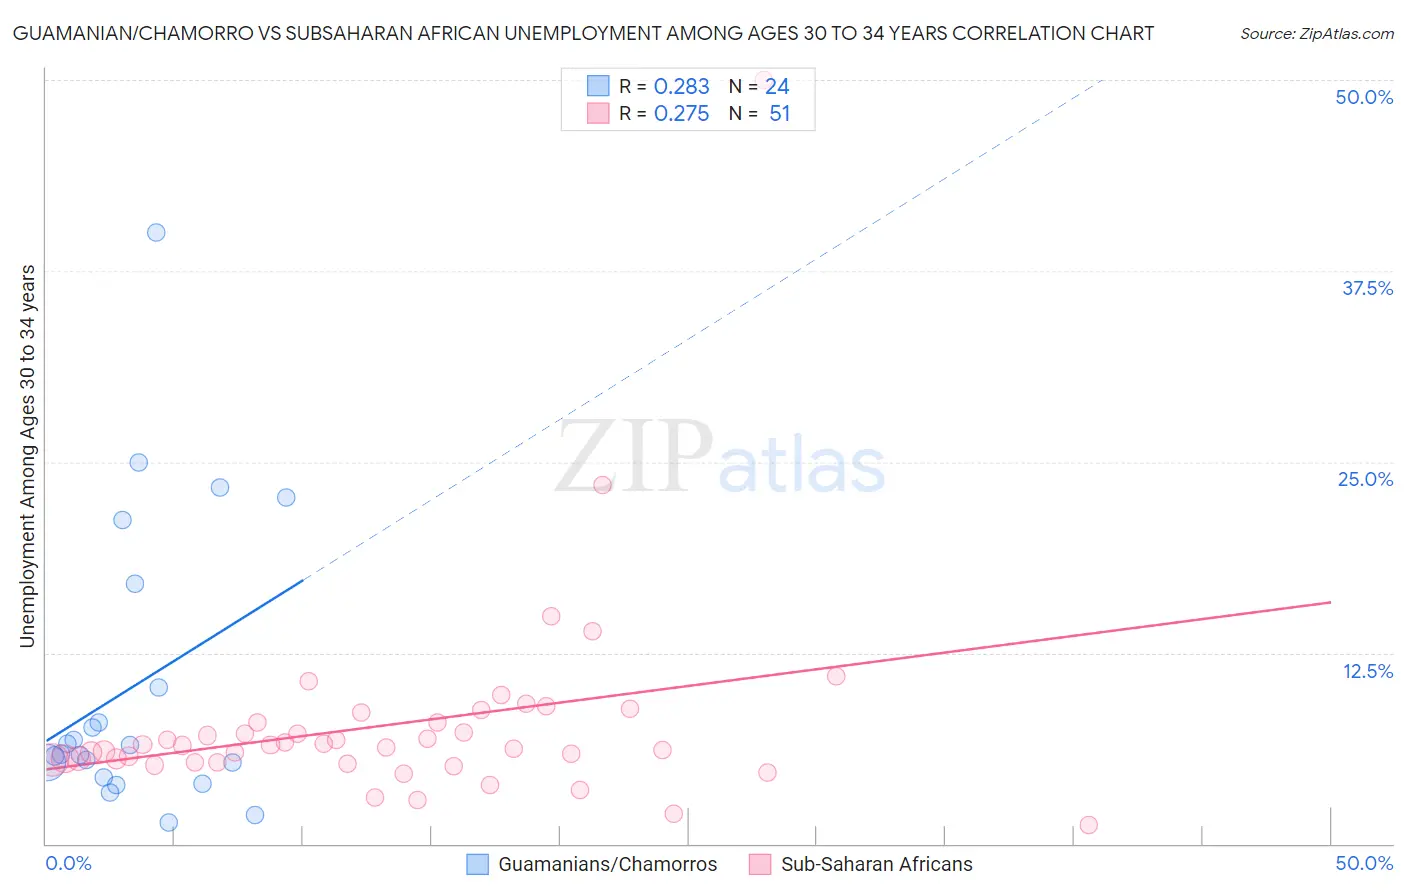
Guamanian/Chamorro vs Subsaharan African Unemployment Among Ages 30 to 34 years Correlation Chart
The statistical analysis conducted on geographies consisting of 215,599,306 people shows a weak positive correlation between the proportion of Guamanians/Chamorros and unemployment rate among population between the ages 30 and 34 in the United States with a correlation coefficient (R) of 0.283 and weighted average of 5.8%. Similarly, the statistical analysis conducted on geographies consisting of 466,998,854 people shows a weak positive correlation between the proportion of Sub-Saharan Africans and unemployment rate among population between the ages 30 and 34 in the United States with a correlation coefficient (R) of 0.275 and weighted average of 6.0%, a difference of 4.1%.
Unemployment Among Ages 30 to 34 years Correlation Summary
| Measurement | Guamanian/Chamorro | Subsaharan African |
| Minimum | 1.4% | 1.2% |
| Maximum | 40.0% | 50.0% |
| Range | 38.6% | 48.8% |
| Mean | 10.3% | 7.8% |
| Median | 6.2% | 6.4% |
| Interquartile 25% (IQ1) | 4.8% | 5.4% |
| Interquartile 75% (IQ3) | 13.6% | 7.9% |
| Interquartile Range (IQR) | 8.8% | 2.6% |
| Standard Deviation (Sample) | 9.5% | 6.9% |
| Standard Deviation (Population) | 9.3% | 6.9% |
Similar Demographics by Unemployment Among Ages 30 to 34 years
Demographics Similar to Guamanians/Chamorros by Unemployment Among Ages 30 to 34 years
In terms of unemployment among ages 30 to 34 years, the demographic groups most similar to Guamanians/Chamorros are Sierra Leonean (5.8%, a difference of 0.020%), French Canadian (5.8%, a difference of 0.23%), Panamanian (5.8%, a difference of 0.26%), Spaniard (5.8%, a difference of 0.33%), and Immigrants from Fiji (5.7%, a difference of 0.47%).
| Demographics | Rating | Rank | Unemployment Among Ages 30 to 34 years |
| Immigrants | Panama | 5.9 /100 | #214 | Tragic 5.7% |
| Immigrants | Cambodia | 5.8 /100 | #215 | Tragic 5.7% |
| Immigrants | Syria | 5.5 /100 | #216 | Tragic 5.7% |
| Immigrants | Fiji | 5.1 /100 | #217 | Tragic 5.7% |
| Panamanians | 4.5 /100 | #218 | Tragic 5.8% |
| French Canadians | 4.4 /100 | #219 | Tragic 5.8% |
| Sierra Leoneans | 3.9 /100 | #220 | Tragic 5.8% |
| Guamanians/Chamorros | 3.9 /100 | #221 | Tragic 5.8% |
| Spaniards | 3.2 /100 | #222 | Tragic 5.8% |
| Bermudans | 2.7 /100 | #223 | Tragic 5.8% |
| Slovaks | 2.5 /100 | #224 | Tragic 5.8% |
| Samoans | 2.5 /100 | #225 | Tragic 5.8% |
| Liberians | 2.3 /100 | #226 | Tragic 5.8% |
| Spanish | 1.8 /100 | #227 | Tragic 5.8% |
| Immigrants | Bahamas | 1.8 /100 | #228 | Tragic 5.8% |
Demographics Similar to Sub-Saharan Africans by Unemployment Among Ages 30 to 34 years
In terms of unemployment among ages 30 to 34 years, the demographic groups most similar to Sub-Saharan Africans are Immigrants from Micronesia (6.0%, a difference of 0.020%), Immigrants from Liberia (6.0%, a difference of 0.18%), Ghanaian (6.0%, a difference of 0.18%), Guatemalan (6.0%, a difference of 0.23%), and Nigerian (6.0%, a difference of 0.25%).
| Demographics | Rating | Rank | Unemployment Among Ages 30 to 34 years |
| Mexican American Indians | 0.6 /100 | #238 | Tragic 5.9% |
| Immigrants | Nigeria | 0.6 /100 | #239 | Tragic 6.0% |
| Salvadorans | 0.5 /100 | #240 | Tragic 6.0% |
| Immigrants | El Salvador | 0.5 /100 | #241 | Tragic 6.0% |
| Guatemalans | 0.4 /100 | #242 | Tragic 6.0% |
| Immigrants | Liberia | 0.4 /100 | #243 | Tragic 6.0% |
| Immigrants | Micronesia | 0.3 /100 | #244 | Tragic 6.0% |
| Sub-Saharan Africans | 0.3 /100 | #245 | Tragic 6.0% |
| Ghanaians | 0.3 /100 | #246 | Tragic 6.0% |
| Nigerians | 0.3 /100 | #247 | Tragic 6.0% |
| Immigrants | Guatemala | 0.3 /100 | #248 | Tragic 6.0% |
| Hondurans | 0.3 /100 | #249 | Tragic 6.0% |
| Immigrants | Honduras | 0.3 /100 | #250 | Tragic 6.0% |
| Tlingit-Haida | 0.2 /100 | #251 | Tragic 6.0% |
| Potawatomi | 0.2 /100 | #252 | Tragic 6.0% |