Guamanian/Chamorro vs Subsaharan African Unemployment Among Ages 35 to 44 years
COMPARE
Guamanian/Chamorro
Subsaharan African
Unemployment Among Ages 35 to 44 years
Unemployment Among Ages 35 to 44 years Comparison
Guamanians/Chamorros
Sub-Saharan Africans
5.1%
UNEMPLOYMENT AMONG AGES 35 TO 44 YEARS
0.9/ 100
METRIC RATING
235th/ 347
METRIC RANK
5.3%
UNEMPLOYMENT AMONG AGES 35 TO 44 YEARS
0.1/ 100
METRIC RATING
260th/ 347
METRIC RANK
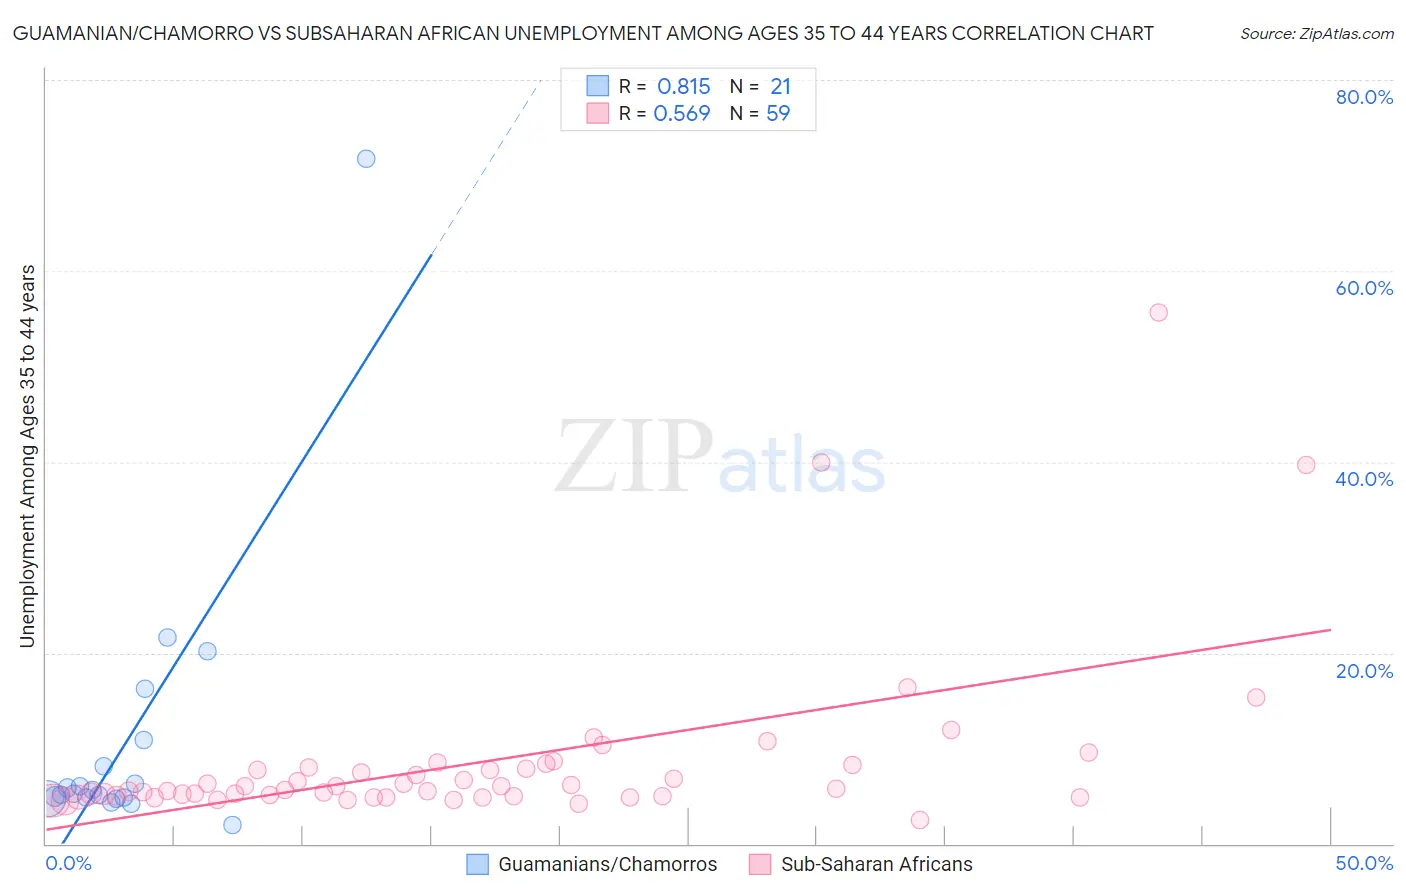
Guamanian/Chamorro vs Subsaharan African Unemployment Among Ages 35 to 44 years Correlation Chart
The statistical analysis conducted on geographies consisting of 219,585,271 people shows a very strong positive correlation between the proportion of Guamanians/Chamorros and unemployment rate among population between the ages 35 and 44 in the United States with a correlation coefficient (R) of 0.815 and weighted average of 5.1%. Similarly, the statistical analysis conducted on geographies consisting of 489,916,914 people shows a substantial positive correlation between the proportion of Sub-Saharan Africans and unemployment rate among population between the ages 35 and 44 in the United States with a correlation coefficient (R) of 0.569 and weighted average of 5.3%, a difference of 3.8%.
Unemployment Among Ages 35 to 44 years Correlation Summary
| Measurement | Guamanian/Chamorro | Subsaharan African |
| Minimum | 1.9% | 2.5% |
| Maximum | 71.7% | 55.6% |
| Range | 69.8% | 53.1% |
| Mean | 10.6% | 8.6% |
| Median | 5.2% | 5.8% |
| Interquartile 25% (IQ1) | 4.8% | 4.9% |
| Interquartile 75% (IQ3) | 9.5% | 7.9% |
| Interquartile Range (IQR) | 4.7% | 3.0% |
| Standard Deviation (Sample) | 15.0% | 9.1% |
| Standard Deviation (Population) | 14.6% | 9.0% |
Similar Demographics by Unemployment Among Ages 35 to 44 years
Demographics Similar to Guamanians/Chamorros by Unemployment Among Ages 35 to 44 years
In terms of unemployment among ages 35 to 44 years, the demographic groups most similar to Guamanians/Chamorros are Central American (5.1%, a difference of 0.21%), Portuguese (5.1%, a difference of 0.26%), Kiowa (5.1%, a difference of 0.26%), Immigrants from Nigeria (5.1%, a difference of 0.33%), and Iroquois (5.1%, a difference of 0.38%).
| Demographics | Rating | Rank | Unemployment Among Ages 35 to 44 years |
| Samoans | 1.8 /100 | #228 | Tragic 5.0% |
| Immigrants | Cambodia | 1.5 /100 | #229 | Tragic 5.0% |
| Liberians | 1.3 /100 | #230 | Tragic 5.1% |
| Japanese | 1.2 /100 | #231 | Tragic 5.1% |
| Iroquois | 1.2 /100 | #232 | Tragic 5.1% |
| Immigrants | Nigeria | 1.2 /100 | #233 | Tragic 5.1% |
| Portuguese | 1.1 /100 | #234 | Tragic 5.1% |
| Guamanians/Chamorros | 0.9 /100 | #235 | Tragic 5.1% |
| Central Americans | 0.8 /100 | #236 | Tragic 5.1% |
| Kiowa | 0.8 /100 | #237 | Tragic 5.1% |
| Hondurans | 0.7 /100 | #238 | Tragic 5.1% |
| Nigerians | 0.7 /100 | #239 | Tragic 5.1% |
| Somalis | 0.7 /100 | #240 | Tragic 5.1% |
| Immigrants | Honduras | 0.6 /100 | #241 | Tragic 5.1% |
| Delaware | 0.5 /100 | #242 | Tragic 5.1% |
Demographics Similar to Sub-Saharan Africans by Unemployment Among Ages 35 to 44 years
In terms of unemployment among ages 35 to 44 years, the demographic groups most similar to Sub-Saharan Africans are Mexican (5.3%, a difference of 0.030%), Immigrants from Latin America (5.3%, a difference of 0.13%), Spanish American (5.3%, a difference of 0.20%), Immigrants from Fiji (5.3%, a difference of 0.25%), and Seminole (5.2%, a difference of 0.53%).
| Demographics | Rating | Rank | Unemployment Among Ages 35 to 44 years |
| Mexican American Indians | 0.2 /100 | #253 | Tragic 5.2% |
| Immigrants | Bahamas | 0.2 /100 | #254 | Tragic 5.2% |
| Cherokee | 0.2 /100 | #255 | Tragic 5.2% |
| Seminole | 0.1 /100 | #256 | Tragic 5.2% |
| Immigrants | Fiji | 0.1 /100 | #257 | Tragic 5.3% |
| Immigrants | Latin America | 0.1 /100 | #258 | Tragic 5.3% |
| Mexicans | 0.1 /100 | #259 | Tragic 5.3% |
| Sub-Saharan Africans | 0.1 /100 | #260 | Tragic 5.3% |
| Spanish Americans | 0.1 /100 | #261 | Tragic 5.3% |
| Immigrants | Central America | 0.1 /100 | #262 | Tragic 5.3% |
| Choctaw | 0.1 /100 | #263 | Tragic 5.3% |
| Ghanaians | 0.1 /100 | #264 | Tragic 5.3% |
| Yaqui | 0.1 /100 | #265 | Tragic 5.3% |
| Immigrants | Bangladesh | 0.1 /100 | #266 | Tragic 5.3% |
| Immigrants | Western Africa | 0.0 /100 | #267 | Tragic 5.3% |