Guamanian/Chamorro vs Central American Unemployment Among Ages 30 to 34 years
COMPARE
Guamanian/Chamorro
Central American
Unemployment Among Ages 30 to 34 years
Unemployment Among Ages 30 to 34 years Comparison
Guamanians/Chamorros
Central Americans
5.8%
UNEMPLOYMENT AMONG AGES 30 TO 34 YEARS
3.9/ 100
METRIC RATING
221st/ 347
METRIC RANK
5.9%
UNEMPLOYMENT AMONG AGES 30 TO 34 YEARS
0.6/ 100
METRIC RATING
237th/ 347
METRIC RANK
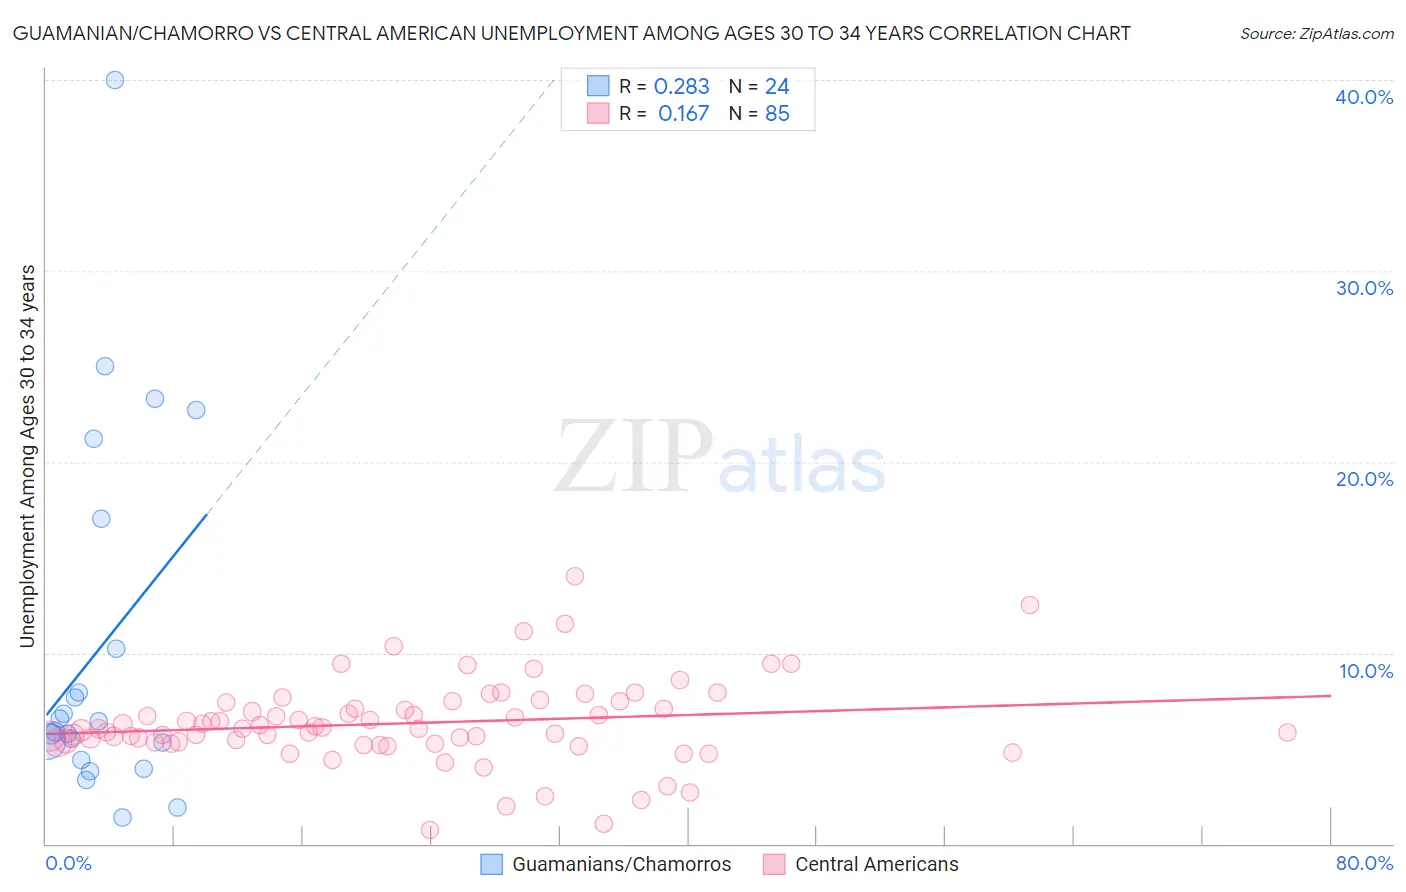
Guamanian/Chamorro vs Central American Unemployment Among Ages 30 to 34 years Correlation Chart
The statistical analysis conducted on geographies consisting of 215,599,306 people shows a weak positive correlation between the proportion of Guamanians/Chamorros and unemployment rate among population between the ages 30 and 34 in the United States with a correlation coefficient (R) of 0.283 and weighted average of 5.8%. Similarly, the statistical analysis conducted on geographies consisting of 462,932,276 people shows a poor positive correlation between the proportion of Central Americans and unemployment rate among population between the ages 30 and 34 in the United States with a correlation coefficient (R) of 0.167 and weighted average of 5.9%, a difference of 3.1%.
Unemployment Among Ages 30 to 34 years Correlation Summary
| Measurement | Guamanian/Chamorro | Central American |
| Minimum | 1.4% | 0.70% |
| Maximum | 40.0% | 14.0% |
| Range | 38.6% | 13.3% |
| Mean | 10.3% | 6.3% |
| Median | 6.2% | 6.0% |
| Interquartile 25% (IQ1) | 4.8% | 5.3% |
| Interquartile 75% (IQ3) | 13.6% | 7.3% |
| Interquartile Range (IQR) | 8.8% | 2.0% |
| Standard Deviation (Sample) | 9.5% | 2.2% |
| Standard Deviation (Population) | 9.3% | 2.2% |
Demographics Similar to Guamanians/Chamorros and Central Americans by Unemployment Among Ages 30 to 34 years
In terms of unemployment among ages 30 to 34 years, the demographic groups most similar to Guamanians/Chamorros are Sierra Leonean (5.8%, a difference of 0.020%), French Canadian (5.8%, a difference of 0.23%), Spaniard (5.8%, a difference of 0.33%), Bermudan (5.8%, a difference of 0.59%), and Slovak (5.8%, a difference of 0.74%). Similarly, the demographic groups most similar to Central Americans are Mexican American Indian (5.9%, a difference of 0.090%), Native Hawaiian (5.9%, a difference of 0.17%), Immigrants from Nigeria (6.0%, a difference of 0.17%), Yaqui (5.9%, a difference of 0.29%), and Portuguese (5.9%, a difference of 0.41%).
| Demographics | Rating | Rank | Unemployment Among Ages 30 to 34 years |
| French Canadians | 4.4 /100 | #219 | Tragic 5.8% |
| Sierra Leoneans | 3.9 /100 | #220 | Tragic 5.8% |
| Guamanians/Chamorros | 3.9 /100 | #221 | Tragic 5.8% |
| Spaniards | 3.2 /100 | #222 | Tragic 5.8% |
| Bermudans | 2.7 /100 | #223 | Tragic 5.8% |
| Slovaks | 2.5 /100 | #224 | Tragic 5.8% |
| Samoans | 2.5 /100 | #225 | Tragic 5.8% |
| Liberians | 2.3 /100 | #226 | Tragic 5.8% |
| Spanish | 1.8 /100 | #227 | Tragic 5.8% |
| Immigrants | Bahamas | 1.8 /100 | #228 | Tragic 5.8% |
| Immigrants | Uzbekistan | 1.5 /100 | #229 | Tragic 5.9% |
| Hawaiians | 1.2 /100 | #230 | Tragic 5.9% |
| Japanese | 1.1 /100 | #231 | Tragic 5.9% |
| Iroquois | 1.0 /100 | #232 | Tragic 5.9% |
| Nepalese | 0.8 /100 | #233 | Tragic 5.9% |
| Portuguese | 0.8 /100 | #234 | Tragic 5.9% |
| Yaqui | 0.7 /100 | #235 | Tragic 5.9% |
| Native Hawaiians | 0.7 /100 | #236 | Tragic 5.9% |
| Central Americans | 0.6 /100 | #237 | Tragic 5.9% |
| Mexican American Indians | 0.6 /100 | #238 | Tragic 5.9% |
| Immigrants | Nigeria | 0.6 /100 | #239 | Tragic 6.0% |