Guamanian/Chamorro vs Hawaiian Unemployment Among Seniors over 65 years
COMPARE
Guamanian/Chamorro
Hawaiian
Unemployment Among Seniors over 65 years
Unemployment Among Seniors over 65 years Comparison
Guamanians/Chamorros
Hawaiians
5.2%
UNEMPLOYMENT AMONG SENIORS OVER 65 YEARS
22.5/ 100
METRIC RATING
197th/ 347
METRIC RANK
5.4%
UNEMPLOYMENT AMONG SENIORS OVER 65 YEARS
0.1/ 100
METRIC RATING
268th/ 347
METRIC RANK
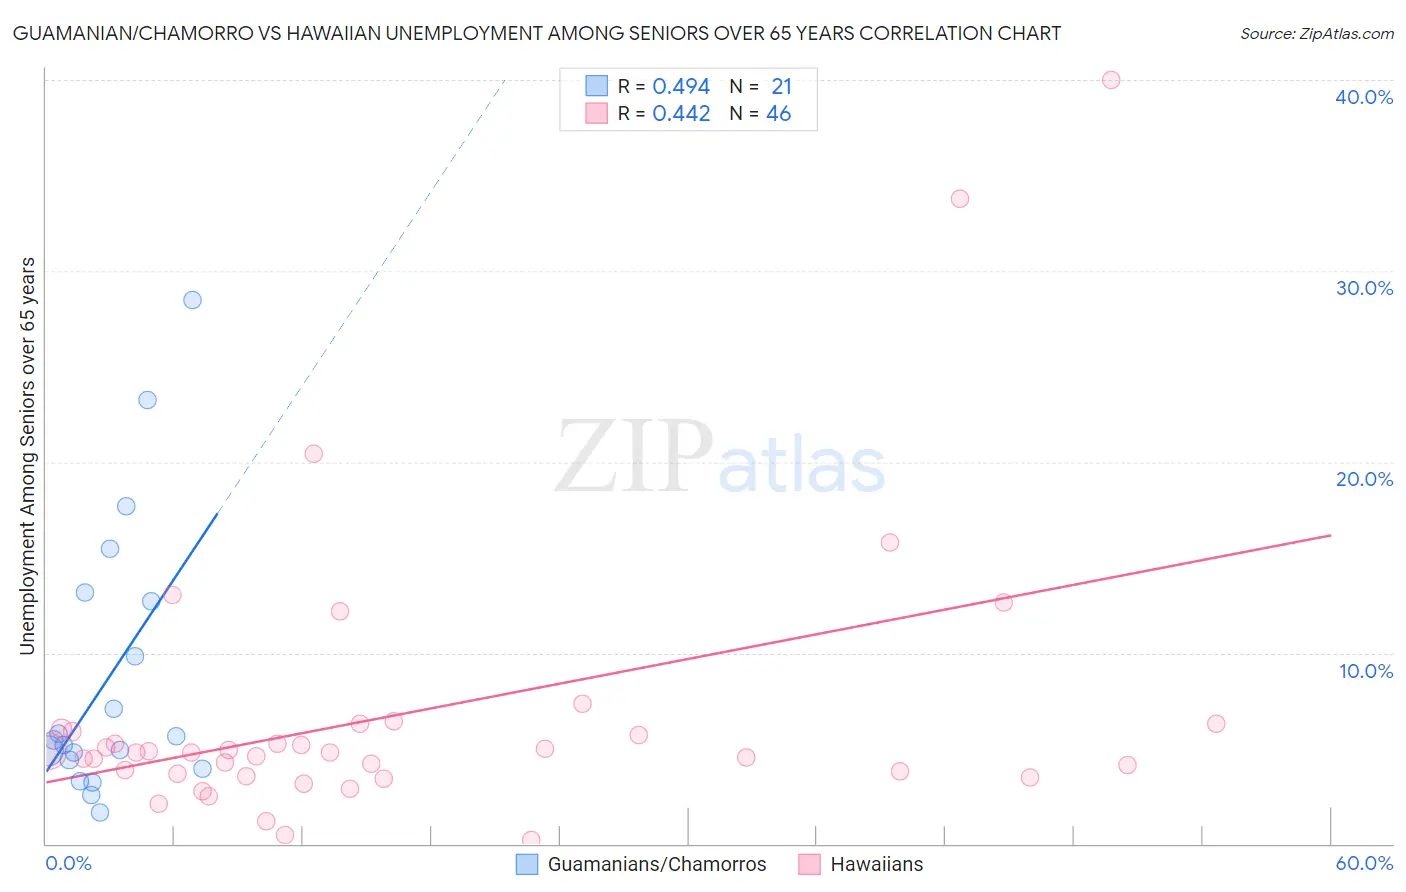
Guamanian/Chamorro vs Hawaiian Unemployment Among Seniors over 65 years Correlation Chart
The statistical analysis conducted on geographies consisting of 208,240,219 people shows a moderate positive correlation between the proportion of Guamanians/Chamorros and unemployment rate amomg seniors over the age of 65 in the United States with a correlation coefficient (R) of 0.494 and weighted average of 5.2%. Similarly, the statistical analysis conducted on geographies consisting of 296,385,493 people shows a moderate positive correlation between the proportion of Hawaiians and unemployment rate amomg seniors over the age of 65 in the United States with a correlation coefficient (R) of 0.442 and weighted average of 5.4%, a difference of 4.2%.
Unemployment Among Seniors over 65 years Correlation Summary
| Measurement | Guamanian/Chamorro | Hawaiian |
| Minimum | 1.7% | 0.20% |
| Maximum | 28.5% | 40.0% |
| Range | 26.8% | 39.8% |
| Mean | 8.7% | 6.8% |
| Median | 5.5% | 4.8% |
| Interquartile 25% (IQ1) | 4.2% | 3.7% |
| Interquartile 75% (IQ3) | 12.9% | 6.0% |
| Interquartile Range (IQR) | 8.8% | 2.3% |
| Standard Deviation (Sample) | 7.2% | 7.5% |
| Standard Deviation (Population) | 7.0% | 7.4% |
Similar Demographics by Unemployment Among Seniors over 65 years
Demographics Similar to Guamanians/Chamorros by Unemployment Among Seniors over 65 years
In terms of unemployment among seniors over 65 years, the demographic groups most similar to Guamanians/Chamorros are Immigrants from Poland (5.2%, a difference of 0.080%), Maltese (5.2%, a difference of 0.14%), Immigrants from Europe (5.2%, a difference of 0.17%), Costa Rican (5.2%, a difference of 0.19%), and Immigrants from Pakistan (5.2%, a difference of 0.20%).
| Demographics | Rating | Rank | Unemployment Among Seniors over 65 years |
| Koreans | 31.6 /100 | #190 | Fair 5.2% |
| Immigrants | Denmark | 31.0 /100 | #191 | Fair 5.2% |
| Sioux | 30.8 /100 | #192 | Fair 5.2% |
| Immigrants | Africa | 29.6 /100 | #193 | Fair 5.2% |
| Argentineans | 29.1 /100 | #194 | Fair 5.2% |
| Costa Ricans | 27.0 /100 | #195 | Fair 5.2% |
| Immigrants | Poland | 24.3 /100 | #196 | Fair 5.2% |
| Guamanians/Chamorros | 22.5 /100 | #197 | Fair 5.2% |
| Maltese | 19.6 /100 | #198 | Poor 5.2% |
| Immigrants | Europe | 19.0 /100 | #199 | Poor 5.2% |
| Immigrants | Pakistan | 18.4 /100 | #200 | Poor 5.2% |
| Laotians | 18.1 /100 | #201 | Poor 5.2% |
| Immigrants | Northern Africa | 17.7 /100 | #202 | Poor 5.2% |
| Sub-Saharan Africans | 17.1 /100 | #203 | Poor 5.2% |
| Immigrants | China | 16.9 /100 | #204 | Poor 5.2% |
Demographics Similar to Hawaiians by Unemployment Among Seniors over 65 years
In terms of unemployment among seniors over 65 years, the demographic groups most similar to Hawaiians are Chippewa (5.4%, a difference of 0.10%), Pennsylvania German (5.4%, a difference of 0.11%), Immigrants from Colombia (5.4%, a difference of 0.12%), Central American Indian (5.4%, a difference of 0.13%), and Immigrants from Southern Europe (5.4%, a difference of 0.14%).
| Demographics | Rating | Rank | Unemployment Among Seniors over 65 years |
| Spanish American Indians | 0.2 /100 | #261 | Tragic 5.4% |
| Immigrants | Grenada | 0.2 /100 | #262 | Tragic 5.4% |
| South Americans | 0.2 /100 | #263 | Tragic 5.4% |
| Central American Indians | 0.2 /100 | #264 | Tragic 5.4% |
| Immigrants | Colombia | 0.2 /100 | #265 | Tragic 5.4% |
| Pennsylvania Germans | 0.2 /100 | #266 | Tragic 5.4% |
| Chippewa | 0.2 /100 | #267 | Tragic 5.4% |
| Hawaiians | 0.1 /100 | #268 | Tragic 5.4% |
| Immigrants | Southern Europe | 0.1 /100 | #269 | Tragic 5.4% |
| Immigrants | Morocco | 0.1 /100 | #270 | Tragic 5.4% |
| Cypriots | 0.1 /100 | #271 | Tragic 5.4% |
| Immigrants | Jamaica | 0.1 /100 | #272 | Tragic 5.4% |
| Immigrants | Nigeria | 0.1 /100 | #273 | Tragic 5.4% |
| Immigrants | Brazil | 0.1 /100 | #274 | Tragic 5.4% |
| Mexican American Indians | 0.1 /100 | #275 | Tragic 5.4% |