Guamanian/Chamorro vs Central American Disability Age 35 to 64
COMPARE
Guamanian/Chamorro
Central American
Disability Age 35 to 64
Disability Age 35 to 64 Comparison
Guamanians/Chamorros
Central Americans
12.2%
DISABILITY AGE 35 TO 64
1.4/ 100
METRIC RATING
246th/ 347
METRIC RANK
11.2%
DISABILITY AGE 35 TO 64
59.1/ 100
METRIC RATING
168th/ 347
METRIC RANK
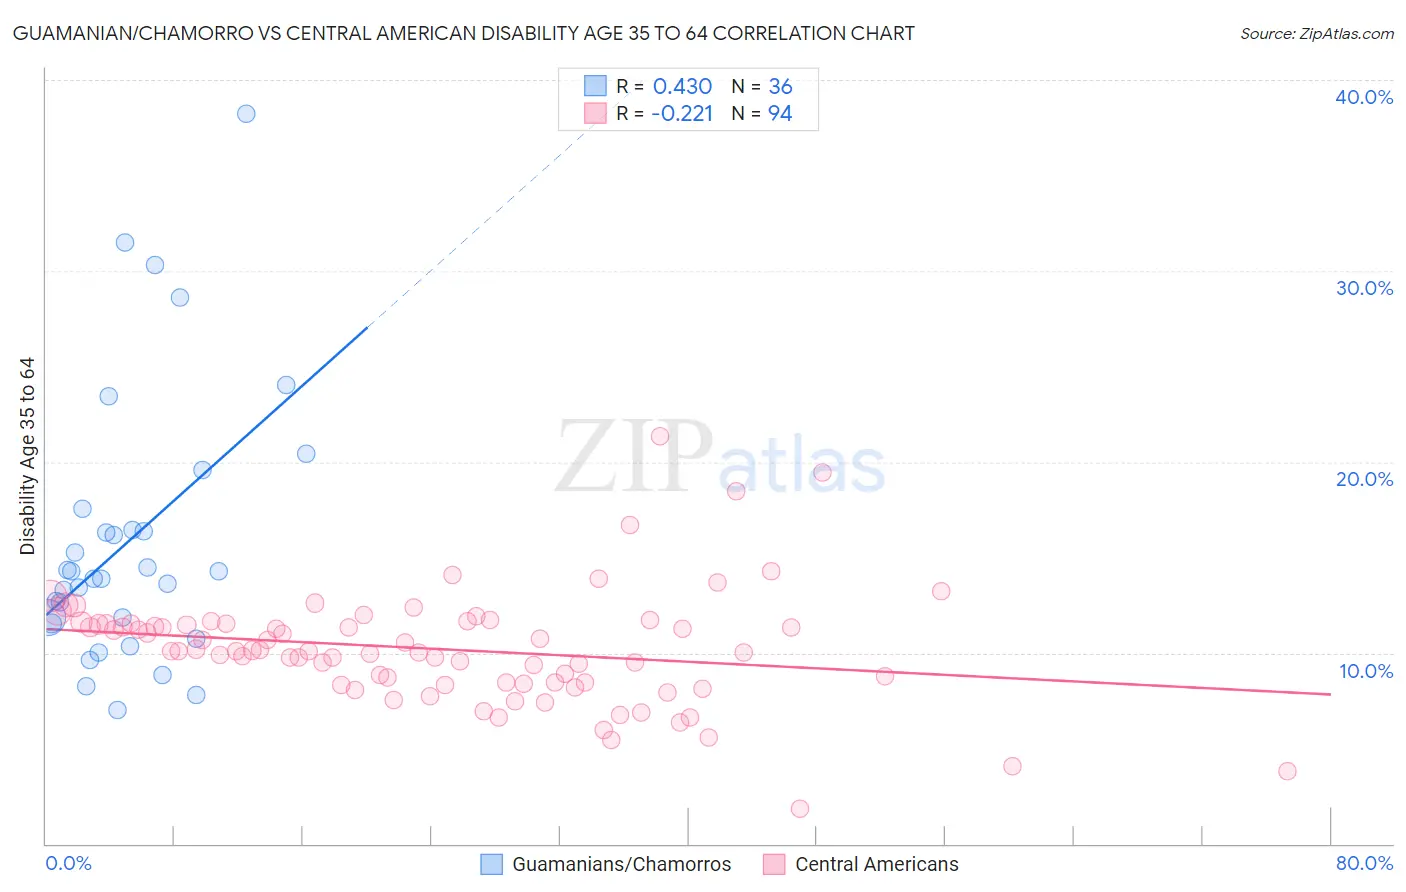
Guamanian/Chamorro vs Central American Disability Age 35 to 64 Correlation Chart
The statistical analysis conducted on geographies consisting of 221,858,951 people shows a moderate positive correlation between the proportion of Guamanians/Chamorros and percentage of population with a disability between the ages 34 and 64 in the United States with a correlation coefficient (R) of 0.430 and weighted average of 12.2%. Similarly, the statistical analysis conducted on geographies consisting of 503,944,688 people shows a weak negative correlation between the proportion of Central Americans and percentage of population with a disability between the ages 34 and 64 in the United States with a correlation coefficient (R) of -0.221 and weighted average of 11.2%, a difference of 9.4%.
Disability Age 35 to 64 Correlation Summary
| Measurement | Guamanian/Chamorro | Central American |
| Minimum | 7.0% | 1.8% |
| Maximum | 38.2% | 21.3% |
| Range | 31.2% | 19.5% |
| Mean | 15.9% | 10.2% |
| Median | 14.1% | 10.1% |
| Interquartile 25% (IQ1) | 11.7% | 8.4% |
| Interquartile 75% (IQ3) | 17.0% | 11.5% |
| Interquartile Range (IQR) | 5.3% | 3.1% |
| Standard Deviation (Sample) | 7.1% | 3.0% |
| Standard Deviation (Population) | 7.0% | 3.0% |
Similar Demographics by Disability Age 35 to 64
Demographics Similar to Guamanians/Chamorros by Disability Age 35 to 64
In terms of disability age 35 to 64, the demographic groups most similar to Guamanians/Chamorros are Immigrants from Senegal (12.2%, a difference of 0.040%), Spaniard (12.3%, a difference of 0.13%), Hispanic or Latino (12.3%, a difference of 0.16%), Immigrants from Burma/Myanmar (12.3%, a difference of 0.29%), and German (12.3%, a difference of 0.37%).
| Demographics | Rating | Rank | Disability Age 35 to 64 |
| Immigrants | Western Africa | 3.3 /100 | #239 | Tragic 12.0% |
| Immigrants | Thailand | 3.3 /100 | #240 | Tragic 12.0% |
| Mexican American Indians | 3.2 /100 | #241 | Tragic 12.0% |
| Samoans | 2.8 /100 | #242 | Tragic 12.1% |
| Slovaks | 2.7 /100 | #243 | Tragic 12.1% |
| Finns | 2.3 /100 | #244 | Tragic 12.1% |
| Immigrants | Mexico | 2.2 /100 | #245 | Tragic 12.1% |
| Guamanians/Chamorros | 1.4 /100 | #246 | Tragic 12.2% |
| Immigrants | Senegal | 1.3 /100 | #247 | Tragic 12.2% |
| Spaniards | 1.3 /100 | #248 | Tragic 12.3% |
| Hispanics or Latinos | 1.3 /100 | #249 | Tragic 12.3% |
| Immigrants | Burma/Myanmar | 1.2 /100 | #250 | Tragic 12.3% |
| Germans | 1.1 /100 | #251 | Tragic 12.3% |
| Irish | 1.0 /100 | #252 | Tragic 12.3% |
| Dutch | 1.0 /100 | #253 | Tragic 12.3% |
Demographics Similar to Central Americans by Disability Age 35 to 64
In terms of disability age 35 to 64, the demographic groups most similar to Central Americans are Haitian (11.2%, a difference of 0.010%), Immigrants from Uganda (11.2%, a difference of 0.090%), Immigrants from Trinidad and Tobago (11.2%, a difference of 0.26%), Italian (11.2%, a difference of 0.29%), and Austrian (11.1%, a difference of 0.35%).
| Demographics | Rating | Rank | Disability Age 35 to 64 |
| Immigrants | Guyana | 70.1 /100 | #161 | Good 11.1% |
| Immigrants | Grenada | 68.4 /100 | #162 | Good 11.1% |
| Immigrants | St. Vincent and the Grenadines | 66.6 /100 | #163 | Good 11.1% |
| Pakistanis | 65.8 /100 | #164 | Good 11.1% |
| Immigrants | Western Europe | 65.2 /100 | #165 | Good 11.1% |
| Immigrants | Haiti | 63.8 /100 | #166 | Good 11.1% |
| Austrians | 63.2 /100 | #167 | Good 11.1% |
| Central Americans | 59.1 /100 | #168 | Average 11.2% |
| Haitians | 59.0 /100 | #169 | Average 11.2% |
| Immigrants | Uganda | 58.0 /100 | #170 | Average 11.2% |
| Immigrants | Trinidad and Tobago | 55.9 /100 | #171 | Average 11.2% |
| Italians | 55.6 /100 | #172 | Average 11.2% |
| Lebanese | 51.8 /100 | #173 | Average 11.3% |
| Immigrants | Fiji | 50.0 /100 | #174 | Average 11.3% |
| Czechs | 47.9 /100 | #175 | Average 11.3% |