French Canadian vs Immigrants from Cabo Verde Unemployment Among Women with Children Ages 6 to 17 years
COMPARE
French Canadian
Immigrants from Cabo Verde
Unemployment Among Women with Children Ages 6 to 17 years
Unemployment Among Women with Children Ages 6 to 17 years Comparison
French Canadians
Immigrants from Cabo Verde
10.3%
UNEMPLOYMENT AMONG WOMEN WITH CHILDREN AGES 6 TO 17 YEARS
0.0/ 100
METRIC RATING
309th/ 347
METRIC RANK
10.4%
UNEMPLOYMENT AMONG WOMEN WITH CHILDREN AGES 6 TO 17 YEARS
0.0/ 100
METRIC RATING
314th/ 347
METRIC RANK
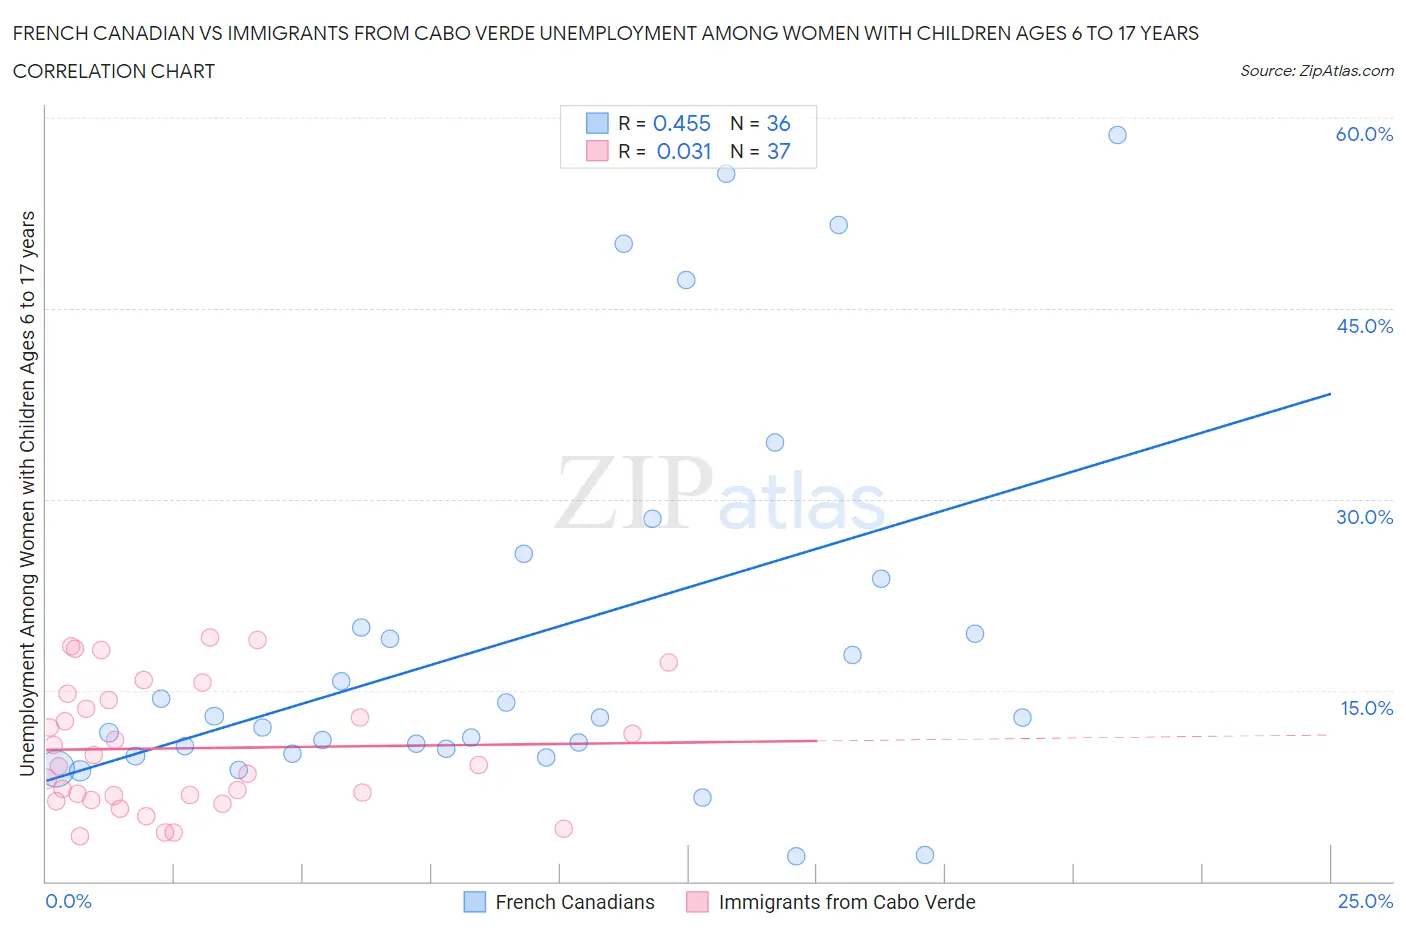
French Canadian vs Immigrants from Cabo Verde Unemployment Among Women with Children Ages 6 to 17 years Correlation Chart
The statistical analysis conducted on geographies consisting of 329,058,978 people shows a moderate positive correlation between the proportion of French Canadians and unemployment rate among women with children between the ages 6 and 17 in the United States with a correlation coefficient (R) of 0.455 and weighted average of 10.3%. Similarly, the statistical analysis conducted on geographies consisting of 33,958,446 people shows no correlation between the proportion of Immigrants from Cabo Verde and unemployment rate among women with children between the ages 6 and 17 in the United States with a correlation coefficient (R) of 0.031 and weighted average of 10.4%, a difference of 1.1%.
Unemployment Among Women with Children Ages 6 to 17 years Correlation Summary
| Measurement | French Canadian | Immigrants from Cabo Verde |
| Minimum | 2.0% | 3.5% |
| Maximum | 58.6% | 19.1% |
| Range | 56.6% | 15.6% |
| Mean | 19.2% | 10.4% |
| Median | 12.9% | 9.1% |
| Interquartile 25% (IQ1) | 10.2% | 6.6% |
| Interquartile 75% (IQ3) | 21.8% | 14.5% |
| Interquartile Range (IQR) | 11.6% | 7.9% |
| Standard Deviation (Sample) | 15.2% | 4.9% |
| Standard Deviation (Population) | 15.0% | 4.8% |
Demographics Similar to French Canadians and Immigrants from Cabo Verde by Unemployment Among Women with Children Ages 6 to 17 years
In terms of unemployment among women with children ages 6 to 17 years, the demographic groups most similar to French Canadians are Alaska Native (10.3%, a difference of 0.050%), Immigrants from Liberia (10.3%, a difference of 0.080%), Dutch West Indian (10.2%, a difference of 0.54%), Immigrants from Senegal (10.2%, a difference of 0.55%), and Paraguayan (10.2%, a difference of 0.78%). Similarly, the demographic groups most similar to Immigrants from Cabo Verde are Bahamian (10.4%, a difference of 0.030%), American (10.4%, a difference of 0.050%), African (10.4%, a difference of 0.23%), Immigrants from Dominica (10.5%, a difference of 0.78%), and Bermudan (10.5%, a difference of 0.89%).
| Demographics | Rating | Rank | Unemployment Among Women with Children Ages 6 to 17 years |
| Immigrants | Bahamas | 0.0 /100 | #301 | Tragic 10.1% |
| Venezuelans | 0.0 /100 | #302 | Tragic 10.2% |
| Immigrants | Ecuador | 0.0 /100 | #303 | Tragic 10.2% |
| Immigrants | Venezuela | 0.0 /100 | #304 | Tragic 10.2% |
| Immigrants | Nigeria | 0.0 /100 | #305 | Tragic 10.2% |
| Paraguayans | 0.0 /100 | #306 | Tragic 10.2% |
| Immigrants | Senegal | 0.0 /100 | #307 | Tragic 10.2% |
| Dutch West Indians | 0.0 /100 | #308 | Tragic 10.2% |
| French Canadians | 0.0 /100 | #309 | Tragic 10.3% |
| Alaska Natives | 0.0 /100 | #310 | Tragic 10.3% |
| Immigrants | Liberia | 0.0 /100 | #311 | Tragic 10.3% |
| Africans | 0.0 /100 | #312 | Tragic 10.4% |
| Americans | 0.0 /100 | #313 | Tragic 10.4% |
| Immigrants | Cabo Verde | 0.0 /100 | #314 | Tragic 10.4% |
| Bahamians | 0.0 /100 | #315 | Tragic 10.4% |
| Immigrants | Dominica | 0.0 /100 | #316 | Tragic 10.5% |
| Bermudans | 0.0 /100 | #317 | Tragic 10.5% |
| Delaware | 0.0 /100 | #318 | Tragic 10.5% |
| Immigrants | Uganda | 0.0 /100 | #319 | Tragic 10.7% |
| Apache | 0.0 /100 | #320 | Tragic 10.7% |
| Tohono O'odham | 0.0 /100 | #321 | Tragic 10.7% |