French American Indian vs Immigrants from Somalia Unemployment Among Ages 25 to 29 years
COMPARE
French American Indian
Immigrants from Somalia
Unemployment Among Ages 25 to 29 years
Unemployment Among Ages 25 to 29 years Comparison
French American Indians
Immigrants from Somalia
7.5%
UNEMPLOYMENT AMONG AGES 25 TO 29 YEARS
0.0/ 100
METRIC RATING
276th/ 347
METRIC RANK
5.5%
UNEMPLOYMENT AMONG AGES 25 TO 29 YEARS
100.0/ 100
METRIC RATING
3rd/ 347
METRIC RANK
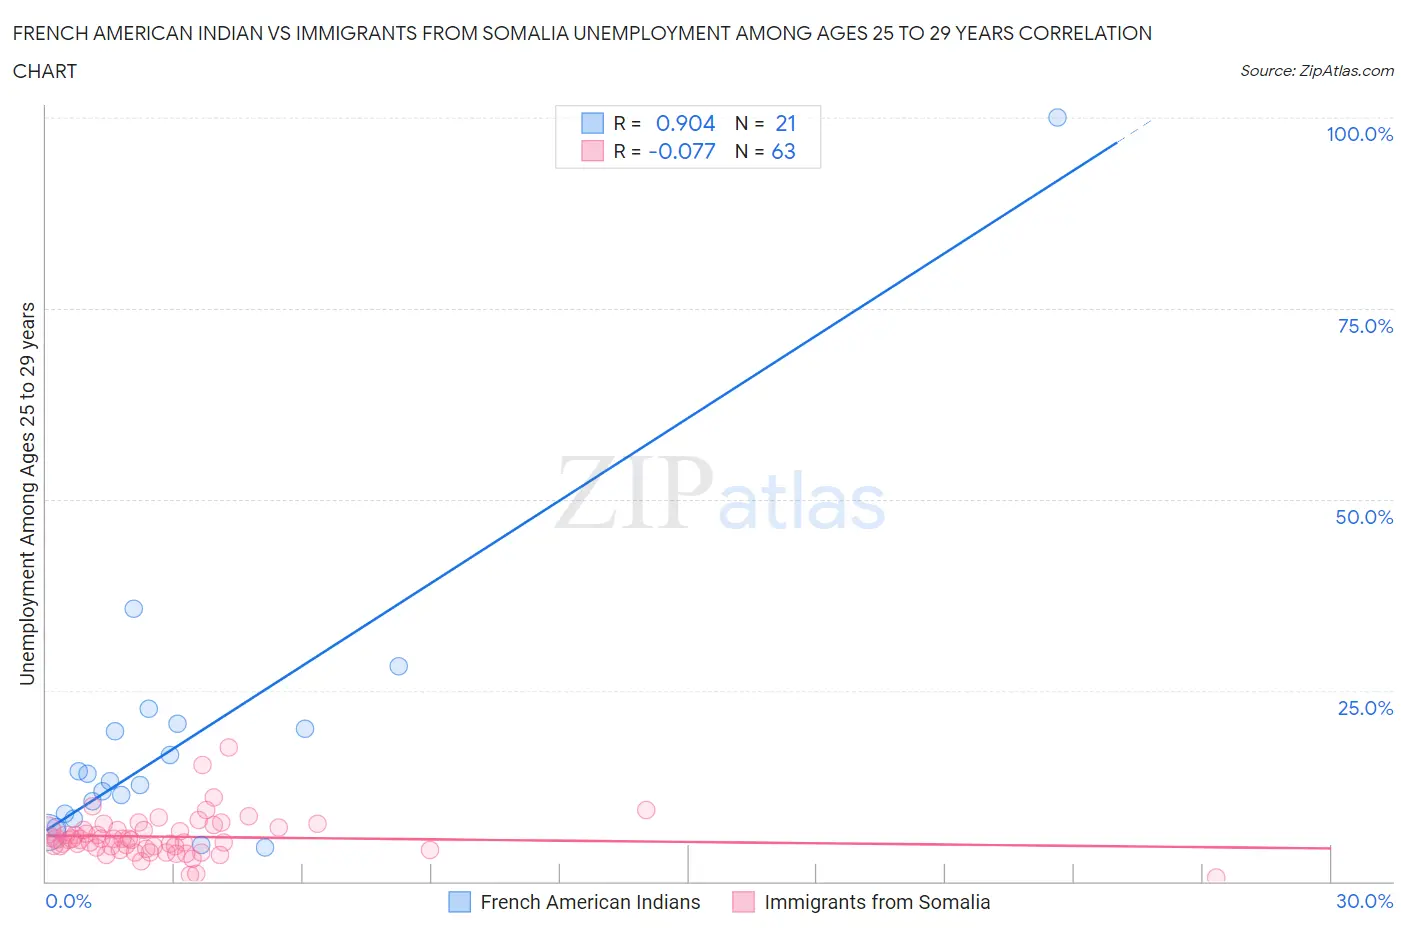
French American Indian vs Immigrants from Somalia Unemployment Among Ages 25 to 29 years Correlation Chart
The statistical analysis conducted on geographies consisting of 127,935,068 people shows a near-perfect positive correlation between the proportion of French American Indians and unemployment rate among population between the ages 25 and 29 in the United States with a correlation coefficient (R) of 0.904 and weighted average of 7.5%. Similarly, the statistical analysis conducted on geographies consisting of 91,266,835 people shows a slight negative correlation between the proportion of Immigrants from Somalia and unemployment rate among population between the ages 25 and 29 in the United States with a correlation coefficient (R) of -0.077 and weighted average of 5.5%, a difference of 35.8%.
Unemployment Among Ages 25 to 29 years Correlation Summary
| Measurement | French American Indian | Immigrants from Somalia |
| Minimum | 4.4% | 0.50% |
| Maximum | 100.0% | 17.5% |
| Range | 95.6% | 17.0% |
| Mean | 18.6% | 5.8% |
| Median | 13.1% | 5.5% |
| Interquartile 25% (IQ1) | 8.5% | 4.2% |
| Interquartile 75% (IQ3) | 20.3% | 6.7% |
| Interquartile Range (IQR) | 11.8% | 2.5% |
| Standard Deviation (Sample) | 20.2% | 2.8% |
| Standard Deviation (Population) | 19.7% | 2.8% |
Similar Demographics by Unemployment Among Ages 25 to 29 years
Demographics Similar to French American Indians by Unemployment Among Ages 25 to 29 years
In terms of unemployment among ages 25 to 29 years, the demographic groups most similar to French American Indians are Iroquois (7.5%, a difference of 0.060%), Mexican (7.5%, a difference of 0.10%), Nepalese (7.5%, a difference of 0.23%), Immigrants from Ghana (7.5%, a difference of 0.34%), and Immigrants from Caribbean (7.5%, a difference of 0.37%).
| Demographics | Rating | Rank | Unemployment Among Ages 25 to 29 years |
| Immigrants | Latin America | 0.1 /100 | #269 | Tragic 7.4% |
| Bahamians | 0.0 /100 | #270 | Tragic 7.5% |
| Choctaw | 0.0 /100 | #271 | Tragic 7.5% |
| Immigrants | Bahamas | 0.0 /100 | #272 | Tragic 7.5% |
| Immigrants | Nigeria | 0.0 /100 | #273 | Tragic 7.5% |
| Immigrants | Central America | 0.0 /100 | #274 | Tragic 7.5% |
| Immigrants | Ghana | 0.0 /100 | #275 | Tragic 7.5% |
| French American Indians | 0.0 /100 | #276 | Tragic 7.5% |
| Iroquois | 0.0 /100 | #277 | Tragic 7.5% |
| Mexicans | 0.0 /100 | #278 | Tragic 7.5% |
| Nepalese | 0.0 /100 | #279 | Tragic 7.5% |
| Immigrants | Caribbean | 0.0 /100 | #280 | Tragic 7.5% |
| Immigrants | Bangladesh | 0.0 /100 | #281 | Tragic 7.5% |
| Immigrants | Senegal | 0.0 /100 | #282 | Tragic 7.6% |
| Creek | 0.0 /100 | #283 | Tragic 7.6% |
Demographics Similar to Immigrants from Somalia by Unemployment Among Ages 25 to 29 years
In terms of unemployment among ages 25 to 29 years, the demographic groups most similar to Immigrants from Somalia are Tongan (5.5%, a difference of 0.31%), Immigrants from Cuba (5.6%, a difference of 2.1%), Somali (5.6%, a difference of 2.1%), Hmong (5.7%, a difference of 2.3%), and Immigrants from India (5.7%, a difference of 2.4%).
| Demographics | Rating | Rank | Unemployment Among Ages 25 to 29 years |
| Sudanese | 100.0 /100 | #1 | Exceptional 5.4% |
| Tongans | 100.0 /100 | #2 | Exceptional 5.5% |
| Immigrants | Somalia | 100.0 /100 | #3 | Exceptional 5.5% |
| Immigrants | Cuba | 100.0 /100 | #4 | Exceptional 5.6% |
| Somalis | 100.0 /100 | #5 | Exceptional 5.6% |
| Hmong | 100.0 /100 | #6 | Exceptional 5.7% |
| Immigrants | India | 100.0 /100 | #7 | Exceptional 5.7% |
| Immigrants | Bosnia and Herzegovina | 100.0 /100 | #8 | Exceptional 5.7% |
| Immigrants | Nepal | 100.0 /100 | #9 | Exceptional 5.7% |
| Immigrants | Sudan | 100.0 /100 | #10 | Exceptional 5.8% |
| Cambodians | 100.0 /100 | #11 | Exceptional 5.8% |
| Okinawans | 100.0 /100 | #12 | Exceptional 5.9% |
| Immigrants | Bolivia | 100.0 /100 | #13 | Exceptional 5.9% |
| Immigrants | Kuwait | 99.9 /100 | #14 | Exceptional 5.9% |
| Cubans | 99.9 /100 | #15 | Exceptional 5.9% |