French American Indian vs South American Unemployment Among Ages 25 to 29 years
COMPARE
French American Indian
South American
Unemployment Among Ages 25 to 29 years
Unemployment Among Ages 25 to 29 years Comparison
French American Indians
South Americans
7.5%
UNEMPLOYMENT AMONG AGES 25 TO 29 YEARS
0.0/ 100
METRIC RATING
276th/ 347
METRIC RANK
6.6%
UNEMPLOYMENT AMONG AGES 25 TO 29 YEARS
54.5/ 100
METRIC RATING
169th/ 347
METRIC RANK
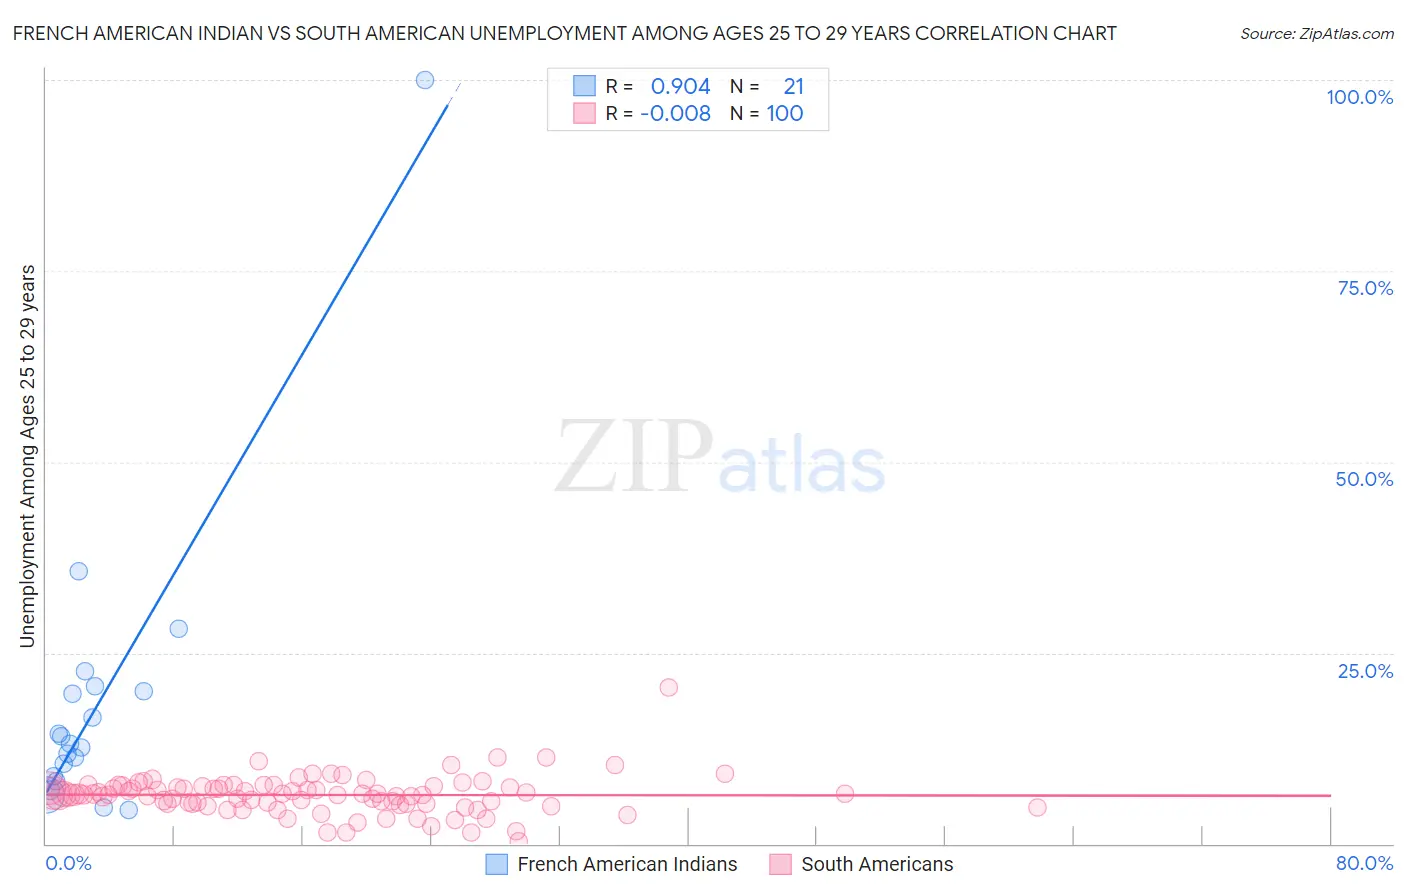
French American Indian vs South American Unemployment Among Ages 25 to 29 years Correlation Chart
The statistical analysis conducted on geographies consisting of 127,935,068 people shows a near-perfect positive correlation between the proportion of French American Indians and unemployment rate among population between the ages 25 and 29 in the United States with a correlation coefficient (R) of 0.904 and weighted average of 7.5%. Similarly, the statistical analysis conducted on geographies consisting of 460,796,066 people shows no correlation between the proportion of South Americans and unemployment rate among population between the ages 25 and 29 in the United States with a correlation coefficient (R) of -0.008 and weighted average of 6.6%, a difference of 13.3%.
Unemployment Among Ages 25 to 29 years Correlation Summary
| Measurement | French American Indian | South American |
| Minimum | 4.4% | 0.30% |
| Maximum | 100.0% | 20.4% |
| Range | 95.6% | 20.1% |
| Mean | 18.6% | 6.4% |
| Median | 13.1% | 6.5% |
| Interquartile 25% (IQ1) | 8.5% | 5.2% |
| Interquartile 75% (IQ3) | 20.3% | 7.5% |
| Interquartile Range (IQR) | 11.8% | 2.3% |
| Standard Deviation (Sample) | 20.2% | 2.5% |
| Standard Deviation (Population) | 19.7% | 2.5% |
Similar Demographics by Unemployment Among Ages 25 to 29 years
Demographics Similar to French American Indians by Unemployment Among Ages 25 to 29 years
In terms of unemployment among ages 25 to 29 years, the demographic groups most similar to French American Indians are Iroquois (7.5%, a difference of 0.060%), Mexican (7.5%, a difference of 0.10%), Nepalese (7.5%, a difference of 0.23%), Immigrants from Ghana (7.5%, a difference of 0.34%), and Immigrants from Caribbean (7.5%, a difference of 0.37%).
| Demographics | Rating | Rank | Unemployment Among Ages 25 to 29 years |
| Immigrants | Latin America | 0.1 /100 | #269 | Tragic 7.4% |
| Bahamians | 0.0 /100 | #270 | Tragic 7.5% |
| Choctaw | 0.0 /100 | #271 | Tragic 7.5% |
| Immigrants | Bahamas | 0.0 /100 | #272 | Tragic 7.5% |
| Immigrants | Nigeria | 0.0 /100 | #273 | Tragic 7.5% |
| Immigrants | Central America | 0.0 /100 | #274 | Tragic 7.5% |
| Immigrants | Ghana | 0.0 /100 | #275 | Tragic 7.5% |
| French American Indians | 0.0 /100 | #276 | Tragic 7.5% |
| Iroquois | 0.0 /100 | #277 | Tragic 7.5% |
| Mexicans | 0.0 /100 | #278 | Tragic 7.5% |
| Nepalese | 0.0 /100 | #279 | Tragic 7.5% |
| Immigrants | Caribbean | 0.0 /100 | #280 | Tragic 7.5% |
| Immigrants | Bangladesh | 0.0 /100 | #281 | Tragic 7.5% |
| Immigrants | Senegal | 0.0 /100 | #282 | Tragic 7.6% |
| Creek | 0.0 /100 | #283 | Tragic 7.6% |
Demographics Similar to South Americans by Unemployment Among Ages 25 to 29 years
In terms of unemployment among ages 25 to 29 years, the demographic groups most similar to South Americans are Estonian (6.6%, a difference of 0.020%), Immigrants from Canada (6.6%, a difference of 0.030%), Albanian (6.6%, a difference of 0.060%), Immigrants from Cambodia (6.6%, a difference of 0.12%), and Immigrants from Northern Europe (6.6%, a difference of 0.18%).
| Demographics | Rating | Rank | Unemployment Among Ages 25 to 29 years |
| Immigrants | Czechoslovakia | 60.2 /100 | #162 | Good 6.6% |
| Immigrants | Middle Africa | 59.4 /100 | #163 | Average 6.6% |
| Greeks | 58.5 /100 | #164 | Average 6.6% |
| English | 58.0 /100 | #165 | Average 6.6% |
| Immigrants | Northern Europe | 57.3 /100 | #166 | Average 6.6% |
| Immigrants | Canada | 55.0 /100 | #167 | Average 6.6% |
| Estonians | 54.8 /100 | #168 | Average 6.6% |
| South Americans | 54.5 /100 | #169 | Average 6.6% |
| Albanians | 53.5 /100 | #170 | Average 6.6% |
| Immigrants | Cambodia | 52.6 /100 | #171 | Average 6.6% |
| Bangladeshis | 51.6 /100 | #172 | Average 6.6% |
| Russians | 51.3 /100 | #173 | Average 6.6% |
| Immigrants | North America | 50.0 /100 | #174 | Average 6.6% |
| Immigrants | South Eastern Asia | 49.1 /100 | #175 | Average 6.7% |
| Osage | 48.1 /100 | #176 | Average 6.7% |