Immigrants from Nicaragua vs Immigrants from Somalia Unemployment Among Ages 25 to 29 years
COMPARE
Immigrants from Nicaragua
Immigrants from Somalia
Unemployment Among Ages 25 to 29 years
Unemployment Among Ages 25 to 29 years Comparison
Immigrants from Nicaragua
Immigrants from Somalia
6.4%
UNEMPLOYMENT AMONG AGES 25 TO 29 YEARS
87.5/ 100
METRIC RATING
112th/ 347
METRIC RANK
5.5%
UNEMPLOYMENT AMONG AGES 25 TO 29 YEARS
100.0/ 100
METRIC RATING
3rd/ 347
METRIC RANK
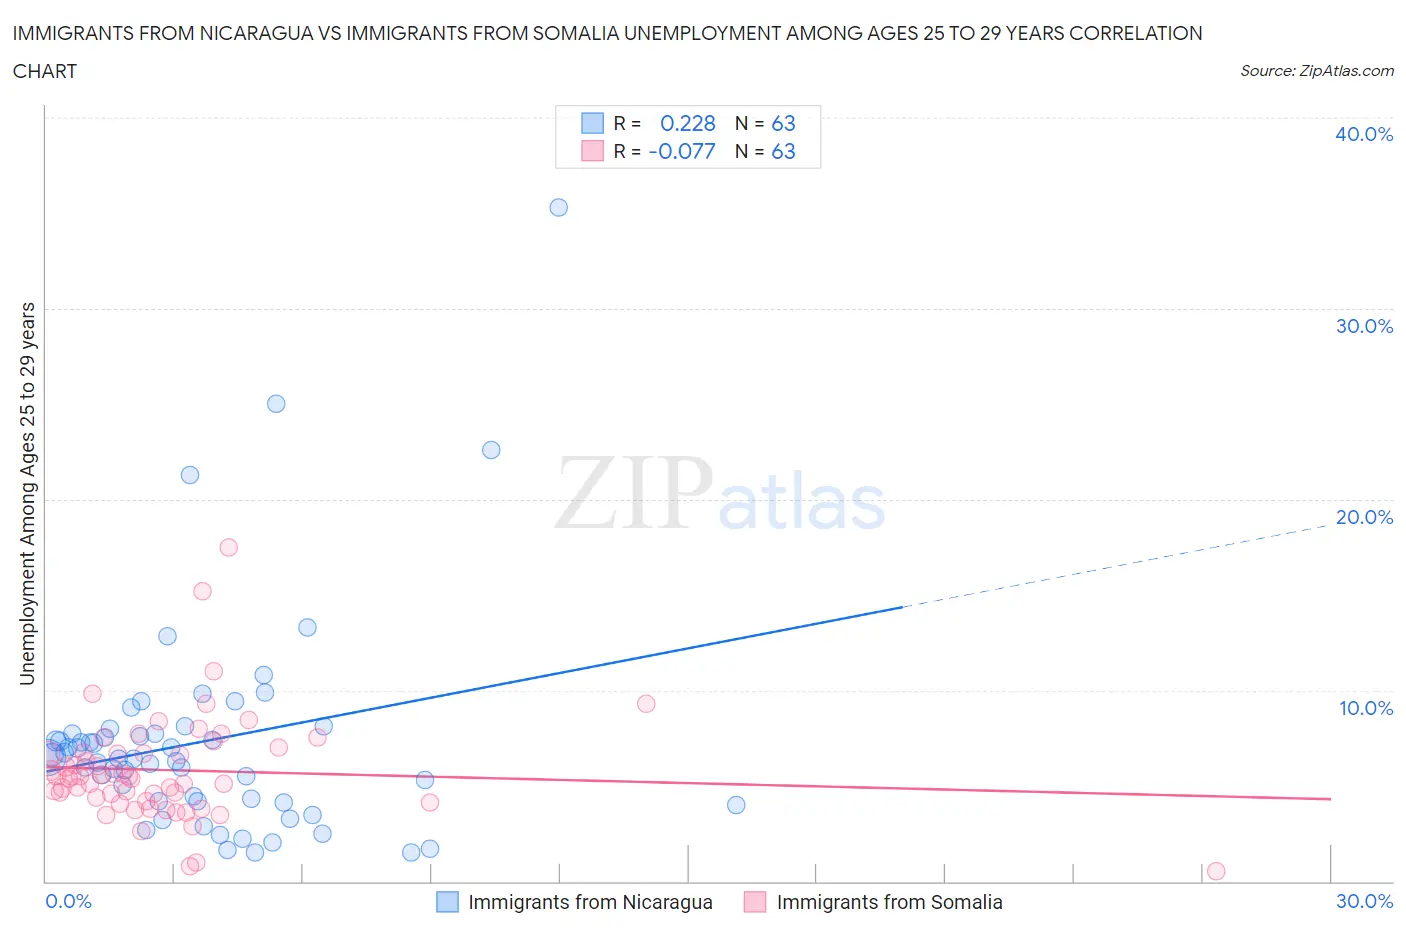
Immigrants from Nicaragua vs Immigrants from Somalia Unemployment Among Ages 25 to 29 years Correlation Chart
The statistical analysis conducted on geographies consisting of 231,259,167 people shows a weak positive correlation between the proportion of Immigrants from Nicaragua and unemployment rate among population between the ages 25 and 29 in the United States with a correlation coefficient (R) of 0.228 and weighted average of 6.4%. Similarly, the statistical analysis conducted on geographies consisting of 91,266,835 people shows a slight negative correlation between the proportion of Immigrants from Somalia and unemployment rate among population between the ages 25 and 29 in the United States with a correlation coefficient (R) of -0.077 and weighted average of 5.5%, a difference of 16.6%.
Unemployment Among Ages 25 to 29 years Correlation Summary
| Measurement | Immigrants from Nicaragua | Immigrants from Somalia |
| Minimum | 1.5% | 0.50% |
| Maximum | 35.3% | 17.5% |
| Range | 33.8% | 17.0% |
| Mean | 7.3% | 5.8% |
| Median | 6.4% | 5.5% |
| Interquartile 25% (IQ1) | 4.2% | 4.2% |
| Interquartile 75% (IQ3) | 7.7% | 6.7% |
| Interquartile Range (IQR) | 3.6% | 2.5% |
| Standard Deviation (Sample) | 5.7% | 2.8% |
| Standard Deviation (Population) | 5.7% | 2.8% |
Similar Demographics by Unemployment Among Ages 25 to 29 years
Demographics Similar to Immigrants from Nicaragua by Unemployment Among Ages 25 to 29 years
In terms of unemployment among ages 25 to 29 years, the demographic groups most similar to Immigrants from Nicaragua are Immigrants from Colombia (6.4%, a difference of 0.020%), Immigrants from Egypt (6.5%, a difference of 0.050%), European (6.4%, a difference of 0.060%), Immigrants from Albania (6.4%, a difference of 0.070%), and Croatian (6.4%, a difference of 0.11%).
| Demographics | Rating | Rank | Unemployment Among Ages 25 to 29 years |
| Immigrants | Kazakhstan | 89.8 /100 | #105 | Excellent 6.4% |
| Immigrants | Hungary | 89.4 /100 | #106 | Excellent 6.4% |
| Swiss | 88.6 /100 | #107 | Excellent 6.4% |
| Croatians | 88.2 /100 | #108 | Excellent 6.4% |
| Immigrants | Albania | 87.9 /100 | #109 | Excellent 6.4% |
| Europeans | 87.8 /100 | #110 | Excellent 6.4% |
| Immigrants | Colombia | 87.6 /100 | #111 | Excellent 6.4% |
| Immigrants | Nicaragua | 87.5 /100 | #112 | Excellent 6.4% |
| Immigrants | Egypt | 87.1 /100 | #113 | Excellent 6.5% |
| Germans | 86.3 /100 | #114 | Excellent 6.5% |
| Macedonians | 86.1 /100 | #115 | Excellent 6.5% |
| Pakistanis | 85.9 /100 | #116 | Excellent 6.5% |
| Immigrants | Uruguay | 85.7 /100 | #117 | Excellent 6.5% |
| Chileans | 85.3 /100 | #118 | Excellent 6.5% |
| Immigrants | South Africa | 84.9 /100 | #119 | Excellent 6.5% |
Demographics Similar to Immigrants from Somalia by Unemployment Among Ages 25 to 29 years
In terms of unemployment among ages 25 to 29 years, the demographic groups most similar to Immigrants from Somalia are Tongan (5.5%, a difference of 0.31%), Immigrants from Cuba (5.6%, a difference of 2.1%), Somali (5.6%, a difference of 2.1%), Hmong (5.7%, a difference of 2.3%), and Immigrants from India (5.7%, a difference of 2.4%).
| Demographics | Rating | Rank | Unemployment Among Ages 25 to 29 years |
| Sudanese | 100.0 /100 | #1 | Exceptional 5.4% |
| Tongans | 100.0 /100 | #2 | Exceptional 5.5% |
| Immigrants | Somalia | 100.0 /100 | #3 | Exceptional 5.5% |
| Immigrants | Cuba | 100.0 /100 | #4 | Exceptional 5.6% |
| Somalis | 100.0 /100 | #5 | Exceptional 5.6% |
| Hmong | 100.0 /100 | #6 | Exceptional 5.7% |
| Immigrants | India | 100.0 /100 | #7 | Exceptional 5.7% |
| Immigrants | Bosnia and Herzegovina | 100.0 /100 | #8 | Exceptional 5.7% |
| Immigrants | Nepal | 100.0 /100 | #9 | Exceptional 5.7% |
| Immigrants | Sudan | 100.0 /100 | #10 | Exceptional 5.8% |
| Cambodians | 100.0 /100 | #11 | Exceptional 5.8% |
| Okinawans | 100.0 /100 | #12 | Exceptional 5.9% |
| Immigrants | Bolivia | 100.0 /100 | #13 | Exceptional 5.9% |
| Immigrants | Kuwait | 99.9 /100 | #14 | Exceptional 5.9% |
| Cubans | 99.9 /100 | #15 | Exceptional 5.9% |